Lincoln County Maps - Online Help Files
On this page:
Introduction to Lincoln County's Online Maps
The mapping tools found at Lincoln County's Online Maps are designed to allow you to explore Lincoln County geographically and acquire information about many datasets, including taxlots, surveys, flood zones, and zoning. This guide will go over how to use Lincoln County's Online Maps, including general navigation, how to identify and select data, and how to search data.
Disclaimer: Lincoln County government use only. Use for any other purpose is entirely at the risk of the user. This product is for informational purposes and may not have been prepared for, or be suitable for legal, engineering, or surveying purposes. Users of this information should review or consult the primary data and information sources to ascertain the usability of the information. Tax Lot Data is For Assessment Purposes Only.
Home Page
Tabs
Zoom To City
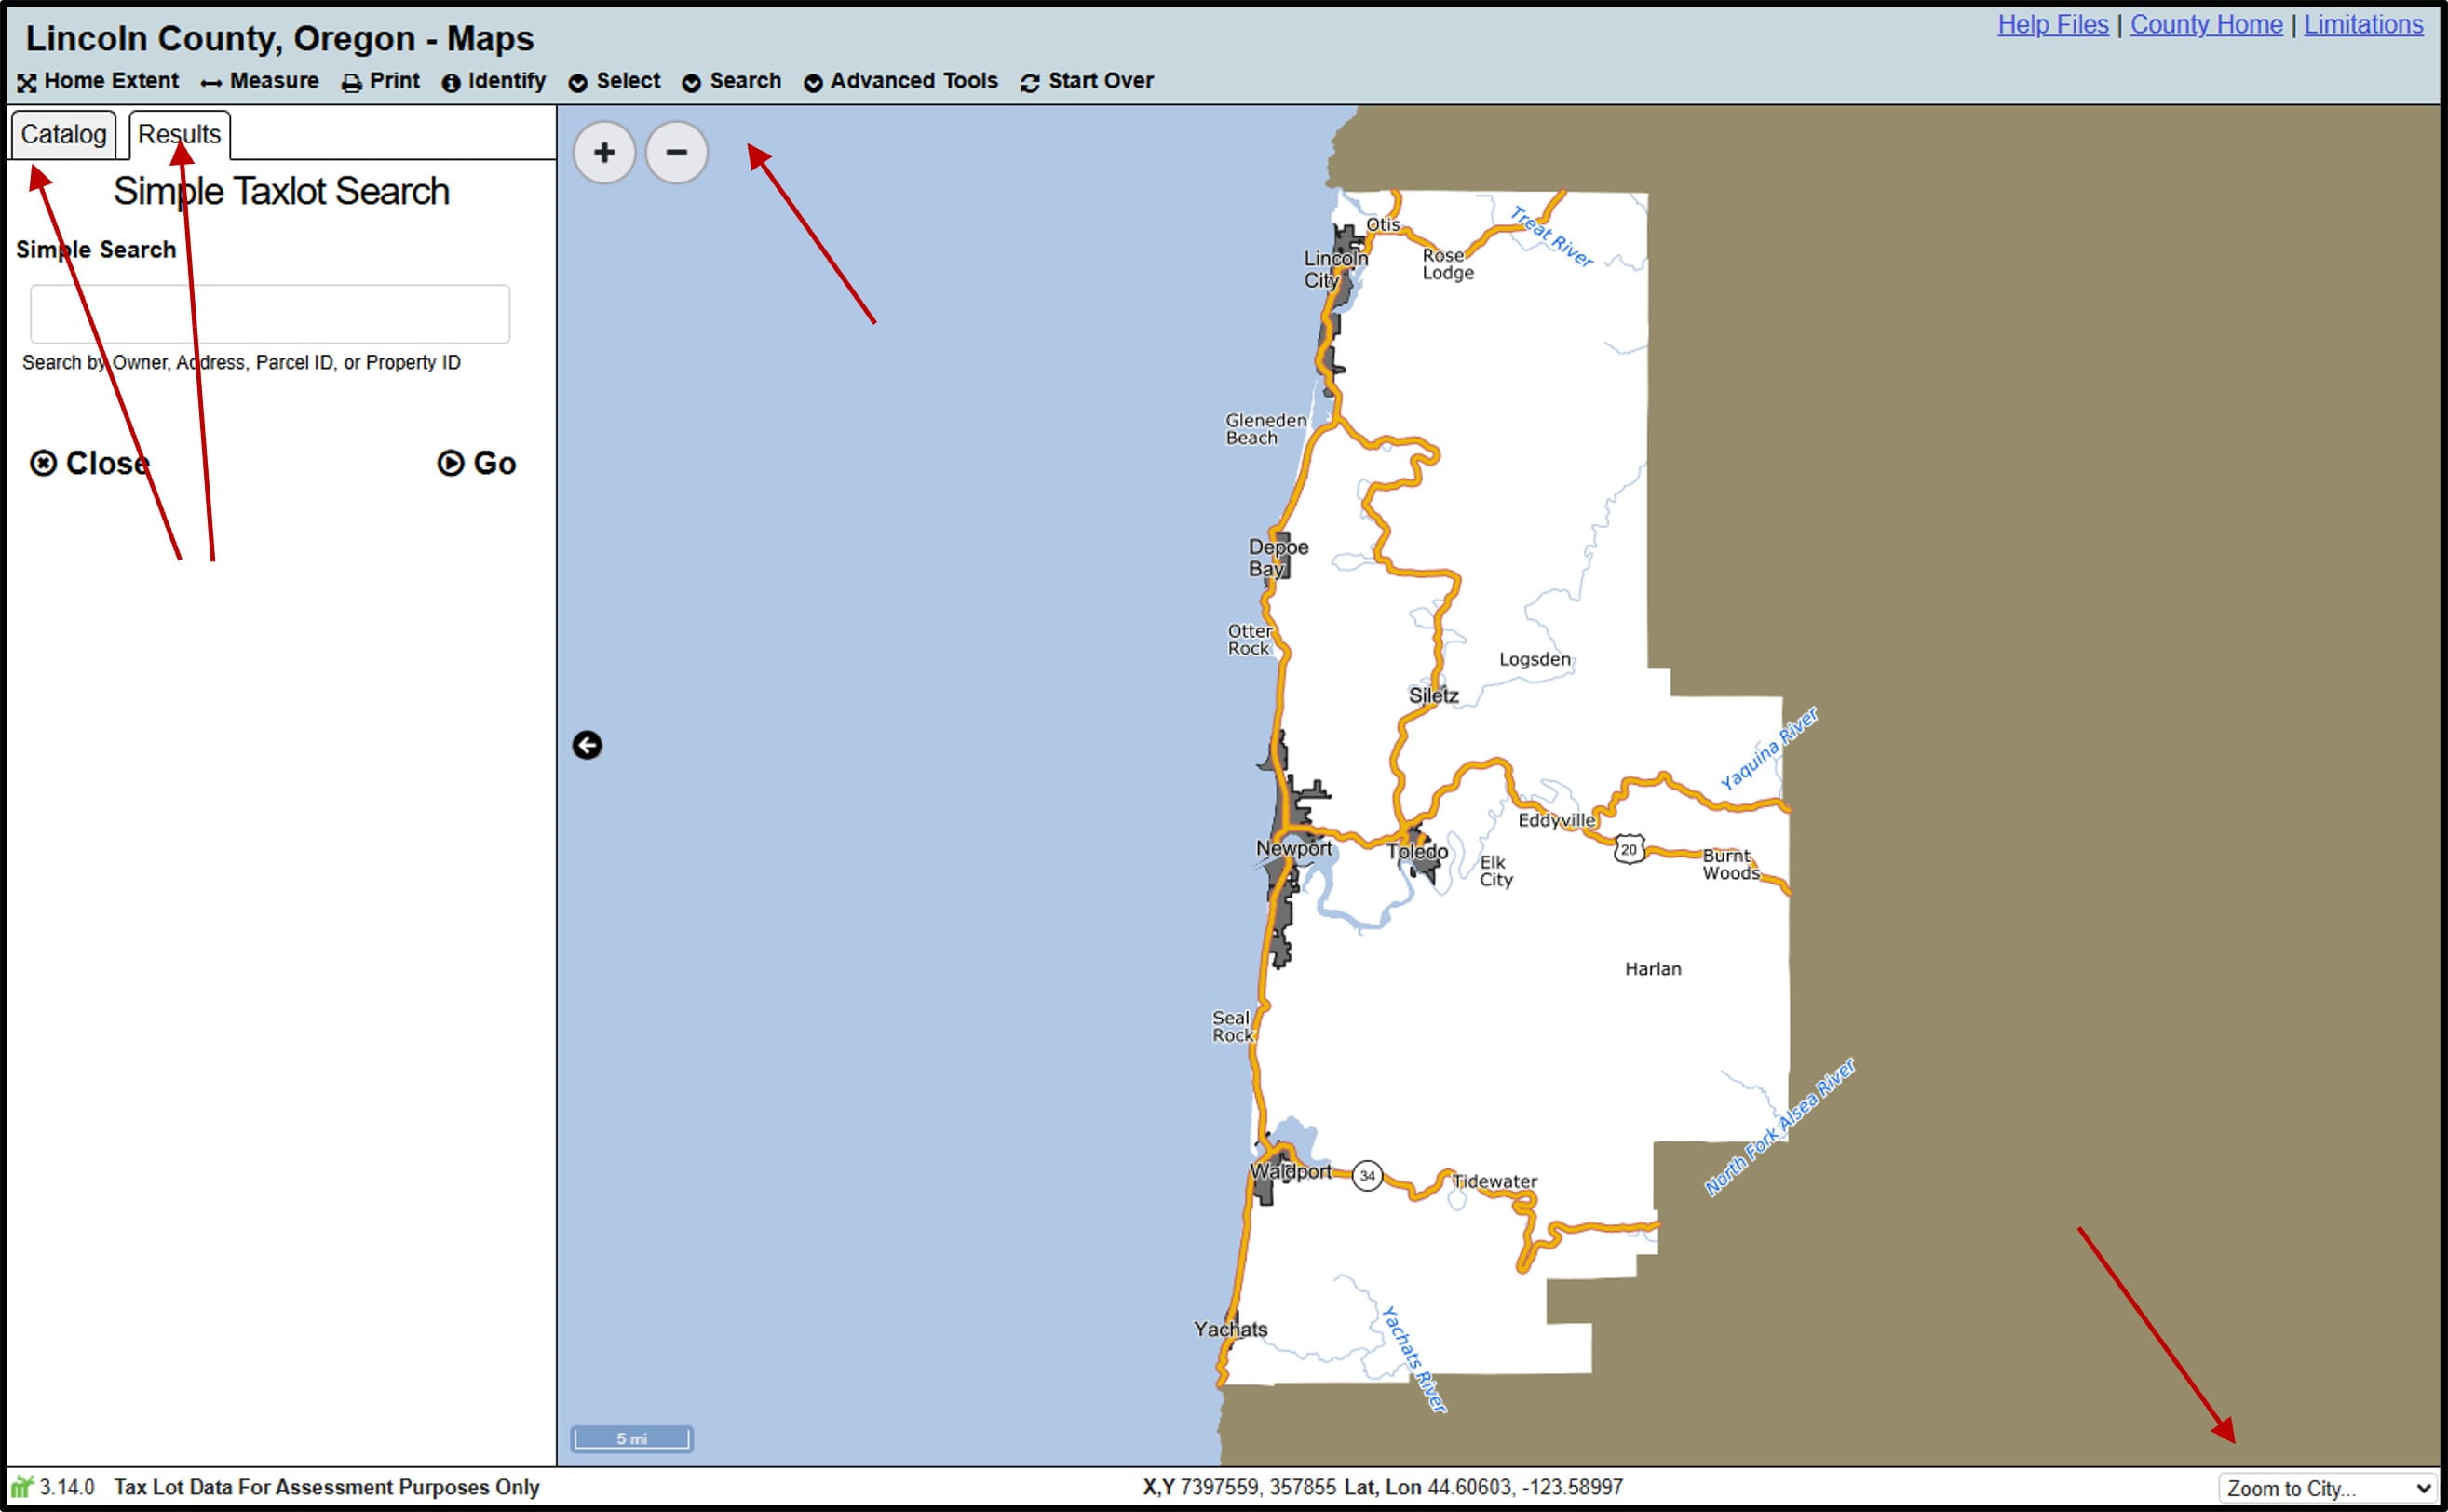
Lincoln County's Online Maps defaults to the extent of Lincoln County, with the Simple Taxlot Search enabled in the tab on the left. This allows users to quickly search for taxlots. Users can also access additional datasets by switching to the catalog tab. Additionally, users can use the toolbar to access additional tools, or use the Zoom To City box in the bottom right hand corner of the map to quickly zoom to any city in Lincoln County.
General Navigation
- Users can click and drag with their mouse to pan around the map, use the scroll wheel to zoom in and out, click the Plus and Minus buttons in the top-left of your map to incrementally zoom in and out, and use the Zoom to City drop-down box in the bottom-right of your map to zoom to various cities within Lincoln County.
- Users can also hold shift while clicking and dragging on the map to draw a box to zoom to.
- Users can also copy the URL or use the Display Bookmark tool to share their map at their current extent with other users.
Toolbar

Below is a list of the tools in the toolbar, allowing users to navigate the map, as well as interact with and share data.
- Home Extent
- The Home Extent button will return you to the full extent of Lincoln County.
- Measure
- The Measure tool allows the user to display coordinates, measure distances, or measure areas of custom polygons, results, and sketches.
- Print
- The Print tool allows the user to export a PDF of their map.
- Identify
- The Identify tool allows users to drop a point on the map, and get results for all datasets at that location, including taxlots, surveys, sections, and various services and districts. Layers need to be on in the catalog in order to be identified.
- Select
- The Select tool allows users to interact with a single dataset by drawing a geometry on the map, and selecting all features that intersect that geometry. To use, open the drop-down menu and select the appropriate dataset.
- Search
- The Search tools allow users to search for taxlots or surveys based on the attribute information in the data (like the Parcel ID for taxlots or Survey number for surveys). To use, open the drop-down menu and choose the appropriate search tool.
- Advanced Tools
- The Advanced Tools drop-down menu allows users to either create a link to their current map or search for a list of taxlots.
- Start Over
- The Start Over tool returns the user to the initial extent of the map and clears any modifications.
Catalog Tools
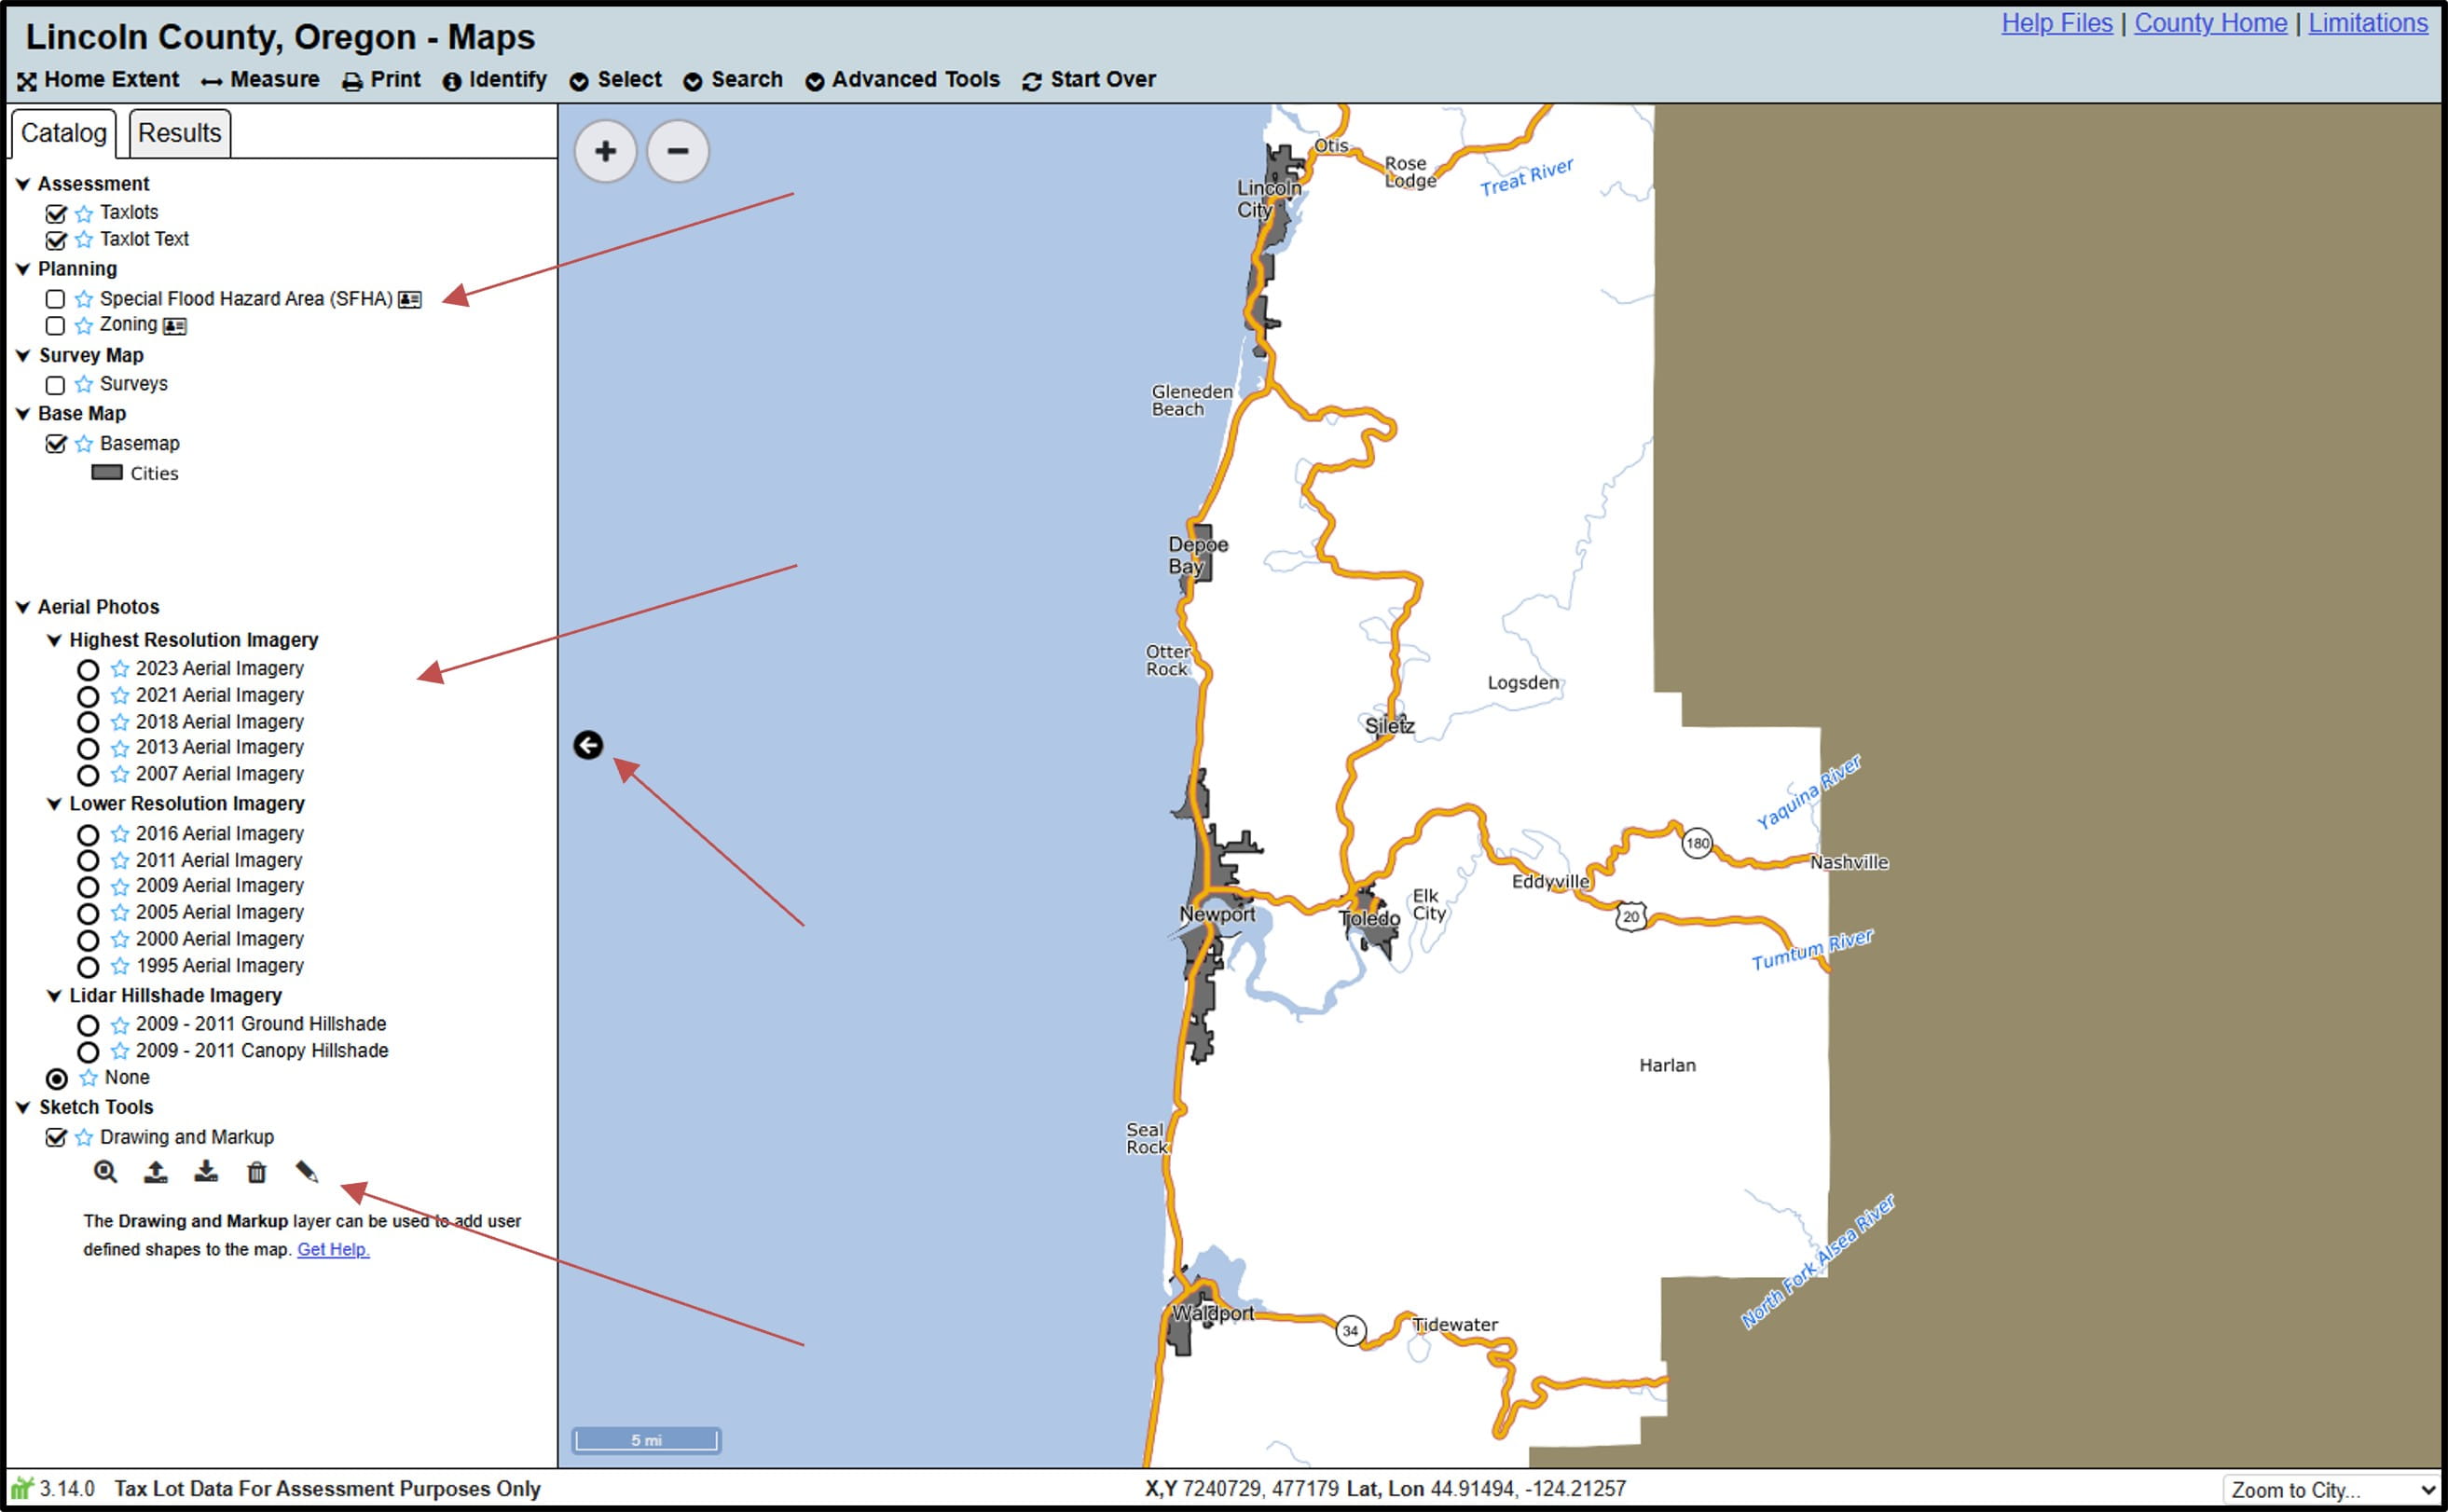
The catalog tab allows you to control what layers are on, access metadata, hide or unhide the tab, and access the Sketch tools.
Layers
Hide Tab
Sketch Tools
- Metadata
- Click the metadata icon
 next to any dataset to view metadata for that dataset.
- Click the metadata icon
- Layers
- Use the catalog tab to control what layers are showing on your map (including aerial photos, taxlots, and surveys). For layers with checkboxes next to them, click the checkbox to turn a layer on or off. For aerial photos that have circles next to them, click the circle to turn a layer on, and click 'None' to turn it off.
- Hide Tab
- The tab toggler icon
 to the right of the tabs allows you to hide or unhide the catalog and results tabs.
- The tab toggler icon
- Sketch Tools
- Use the Sketch tools (found at the bottom of the catalog) to create custom designs, edit sketches, import or export sketches, and add labels to the map. Further information on how to use the sketch tools can be found in the Sketch tools section of these help files.
Identify Tool
The Identify tool allows you to drop a point on the map and get general information at that location, including taxlots, surveys, sections, and various services and districts. Be aware that some datasets may require you to turn them on in the catalog before identifying them.
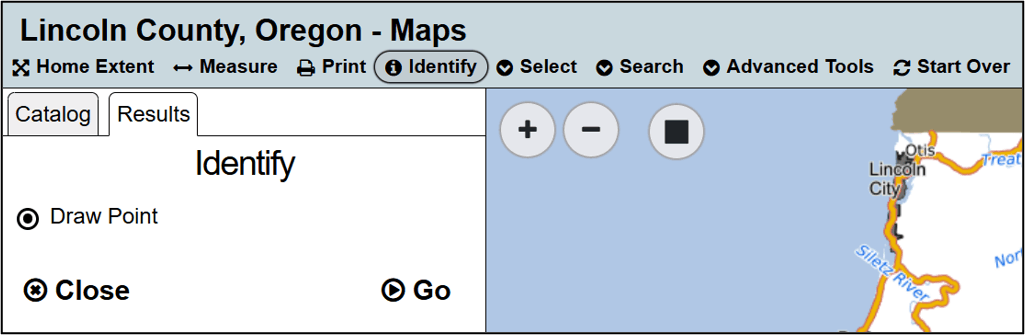
To use the Identify tool, click on Identify in the toolbar. Your cursor will change to include a blue dot, showing that the tool is active. At this point you can click on the map to identify that location. Any results will appear in the results tab. You can keep clicking on the map to identify more locations as long as the Identify tool remains active.
Identify Results
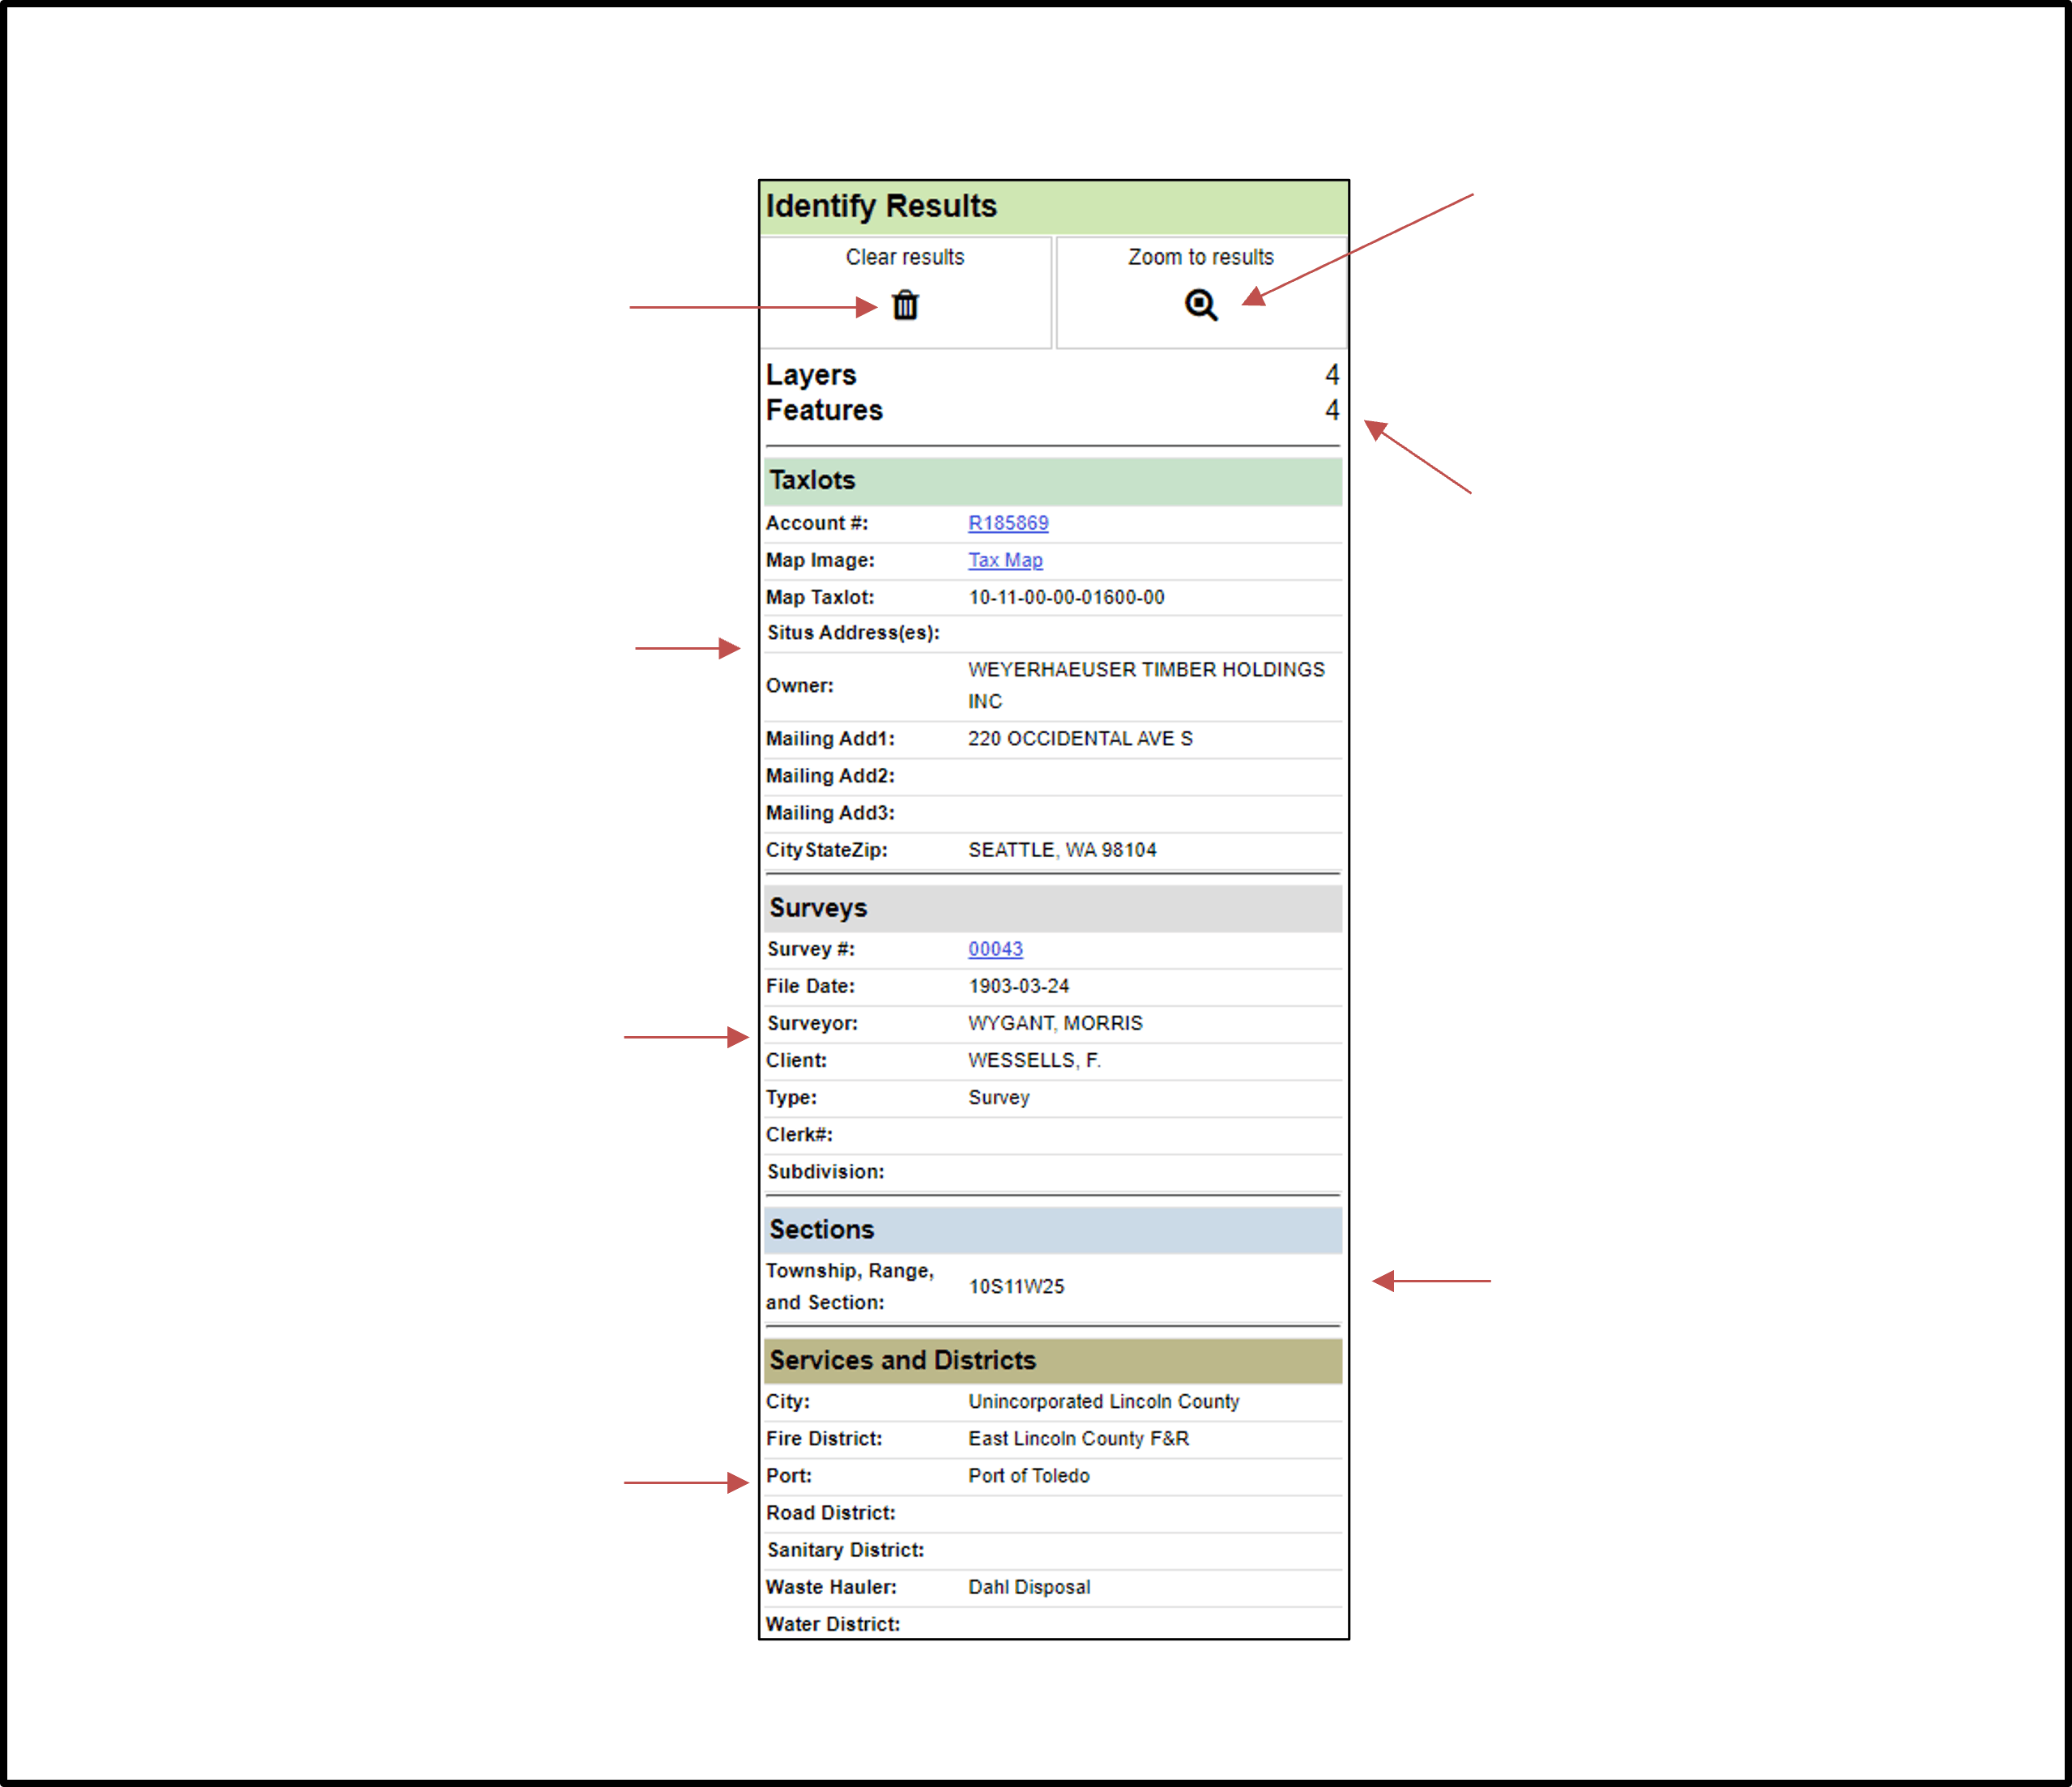
Once the identification is complete, the results will appear in the results tab, showing all the features at the point that the user identified. The image below shows an example of the identify results, with icons at the top allowing users to clear results, or zoom to results.
Remove Results
See taxlots
See surveys
See services and districts
Zoom to Results
See the number of identifiable layers and the number of results
See the township, range, and section
- Attributes
- The attribute information for your results will be found in the results tab to the left of the map. Some datasets include links to additional information, like the tax map or property report for taxlots, and the scanned survey for surveys. Additionally, the Identify tool will show you whether there are any districts at that location, including cities, fire districts, ports, road ditricts, sanitary districts, waste haulers, and water districts.
- Clear Results
- The trash can icon
 results removes all results.
- The trash can icon
- Zoom to Results
- The magnifying glass icon
 zooms your map to your results.
- The magnifying glass icon
Select Tool
While the Identify tool allows you to find general information for multiple datasets at a given location, the Select tool allows you to interact directly with a single dataset. To use the Select tool, first choose the appropriate dataset in the drop-down menu.
After choosing a dataset to select, create a geometry on your map using either Draw Box, Draw Point, Draw Line, or Draw Polygon. Draw Box is the default option. Once you have a geometry on your map, run the Select tool by either clicking Go, or hitting Enter on your keyboard.
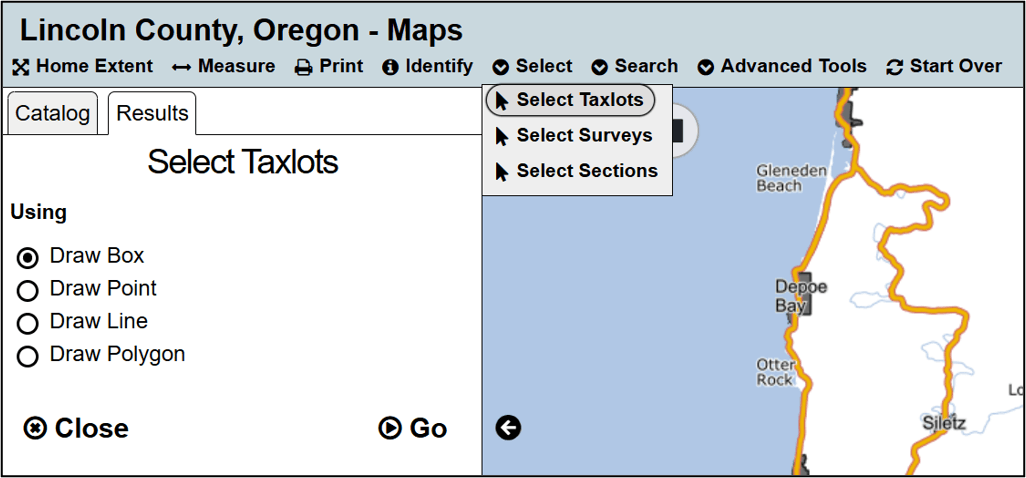
- Draw Box
- Click once to start drawing a box. Click again to finish drawing a box.
- Draw Point
- Click to drop a point on your map. Clicking again will replace that point with a new one.
- Draw Line
- Click to start drawing a line. Continue clicking to add vertices. Double Click to finish your line.
- Draw Polygon
- Click to start drawing a polygon. Continue clicking to add vertices. Double click or click on the first vertex to finish drawing your polygon.
For all selection types, creating a new geometry erases the old one. If you don't like your first polygon, simply create a new one to replace the old one.
After running a selection, results will appear in the results tab. You can also view results in a table which gives you more options for exploring your results. Interacting with results is discussed further in the Results Help section of these help files
Taxlot Search Tool
One of the primary goals for Lincoln County's Online Maps is to provide you searchable access to property information in Lincoln County. Multiple tools are available for searching for taxlots based on attributes.
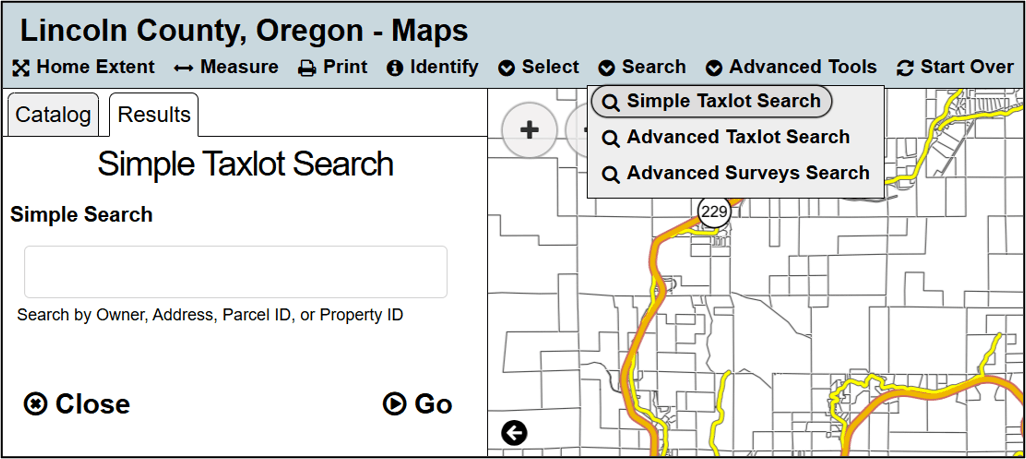
Simple Taxlot Search
The Simple Taxlot Search lets you find taxlots quickly. With a simple entry you can search by owner name, address, account number, or map taxlot number. It can be found in the Search drop-down menu and is enabled by default when you access our online maps.
- Owner Name
- Enter the last and/or first name separated by a space (i.e. Lincoln County or Hughes).
- Address
- Enter the street name, or house number, direction, and street name separated by a space (i.e. 210 SW 2nd).
- Account Number
- Enter R followed by a single five or six digit account number (i.e. R430093).
- Map Taxlot
- Enter the map taxlot number for the account (i.e. 11-11-08-BA-02600). Remember to include leading and trailing 0’s as needed (See example 3 of the Advanced Taxlot Search help if needed).
In general, providing less specific information returns more results. For example, if 180 NE Siletz HWY returns no results, try searching Siletz HWY or Siletz. You can then use the sort and filter functions in the results table to explore or refine your results.
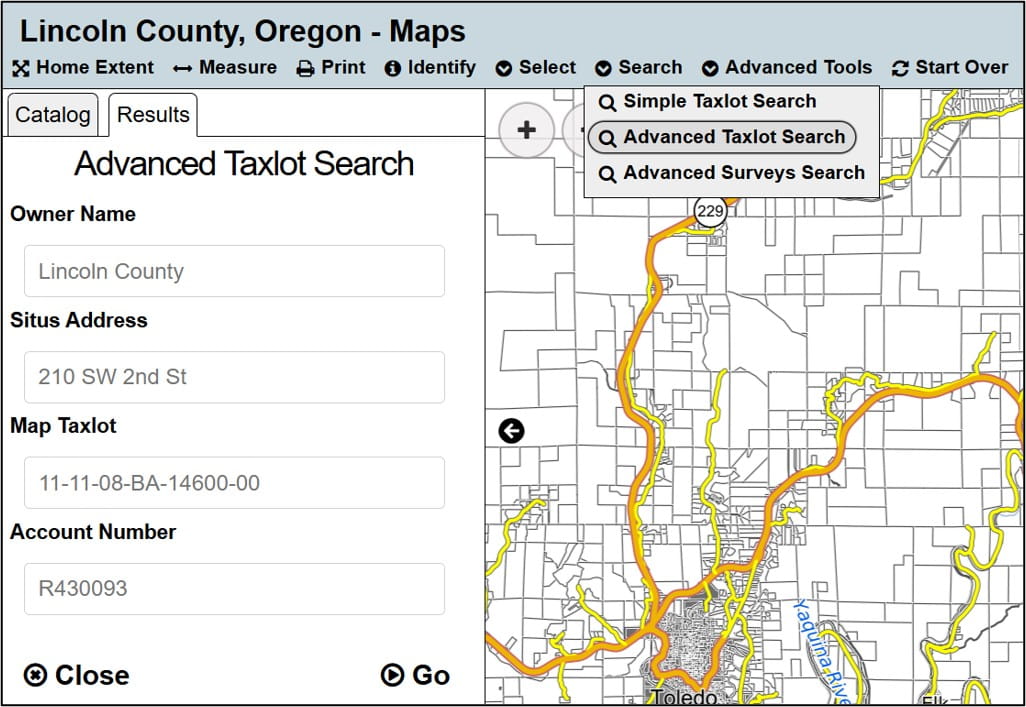
Advanced Taxlot Search
The Advanced Taxlot Search lets you search on multiple attributes when searching for taxlots to more easily find specific results. It is also found in the Search drop-down menu. The search options for the advanced taxlot search are owner name, situs address, map taxlot, and account number.
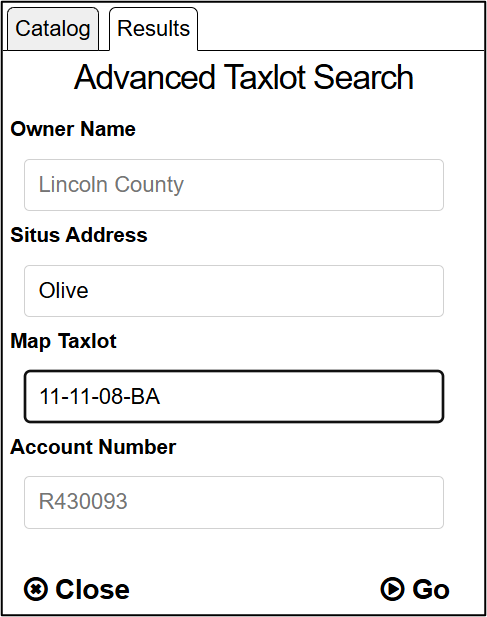
Add information in the specific box to search for that attribute. Add information in multiple boxes to search for results that match both attributes. Placeholders are provided in light gray as examples for how to search the dataset. These placeholders are for reference only and do not count as a search input.
Example 1
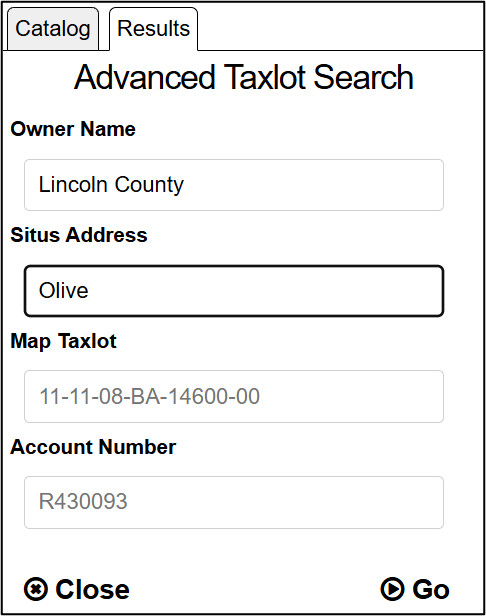
Find a taxlot owned by Lincoln County with an address on Olive Street by entering Lincoln County in the Owner Name box and Olive into the Situs Address box.
Example 2
Find a taxlot with a Parcel ID that begins with 11-11-08-BA on Olive Street by entering Olive into the Situs Address box and 11-11-08-BA into the Map Taxlot box.
Example 3
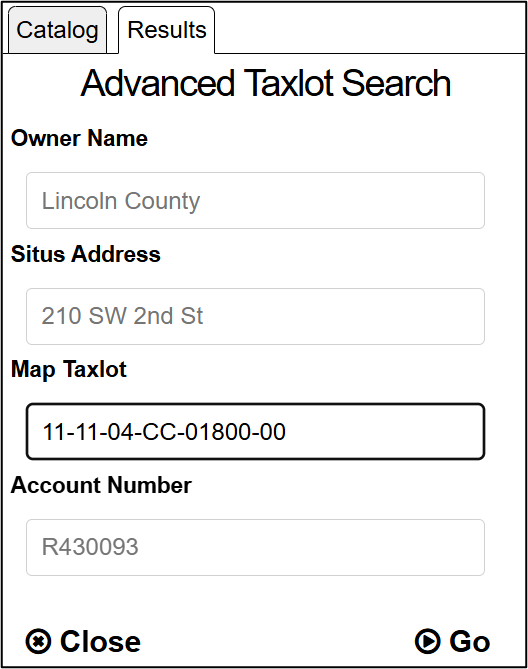
Find the taxlot with the Map Taxlot number of 11-11-04-CC-01800-00 by entering it into the Map Taxlot box. Note that the taxlot number includes leading 0's for any taxlot with less than 5 digits (i.e. 01800 instead of 1800)
Search Taxlots by List
The Search Taxlots by List tool is found in the Advanced Tools drop-down menu of the toolbar (located between the Search drop-down menu and the Start Over tool). It allows you to input a comma-separated list of taxlots, using either the map taxlot number or the account number, and search for them all at once.
Enter a list of either account numbers (including the leading R) or parcel ID’s (including any leading or trailing 0’s). Remember to use a comma (and only a comma) between values. The results will include any taxlot that matches any of the account numbers or parcel IDs.
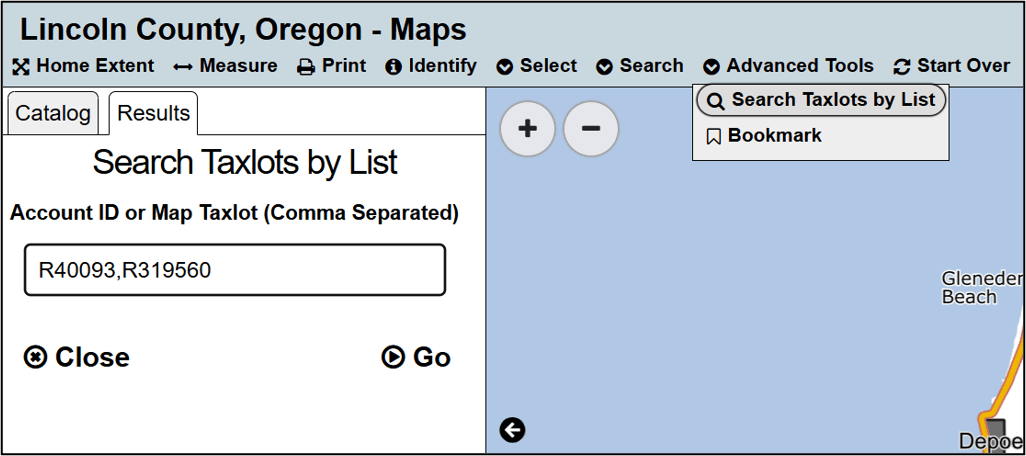
In this example, the user is searching for both R430093 and R319560 by entering R40093,R319560 into the Account ID or Map Taxlot (Comma Separated) box.
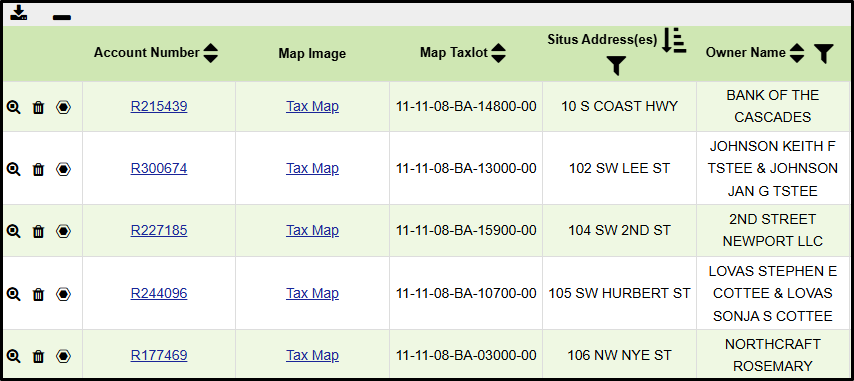
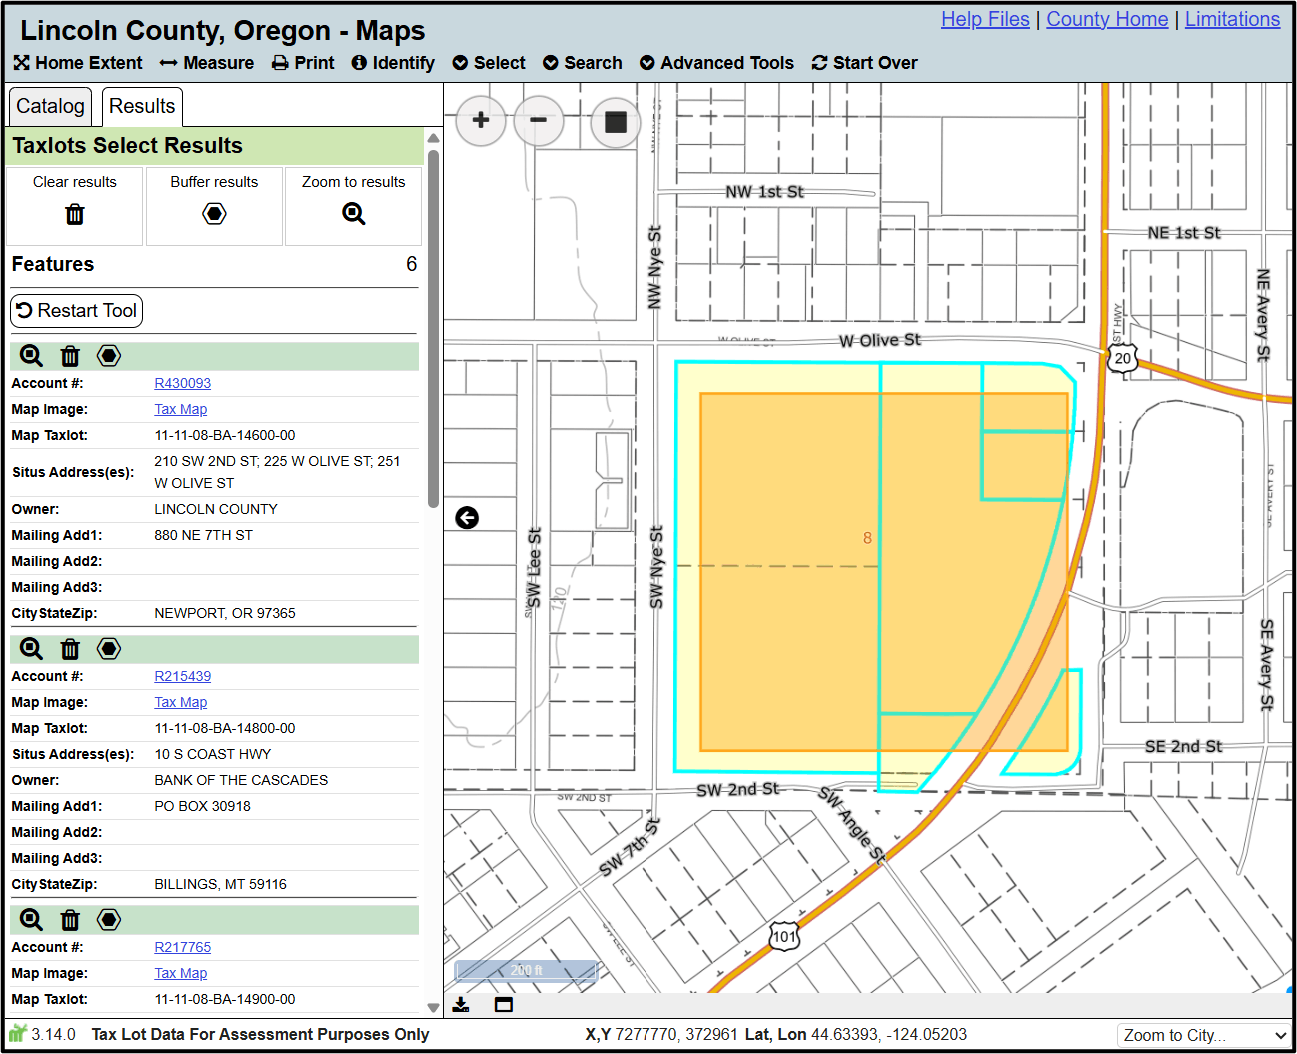
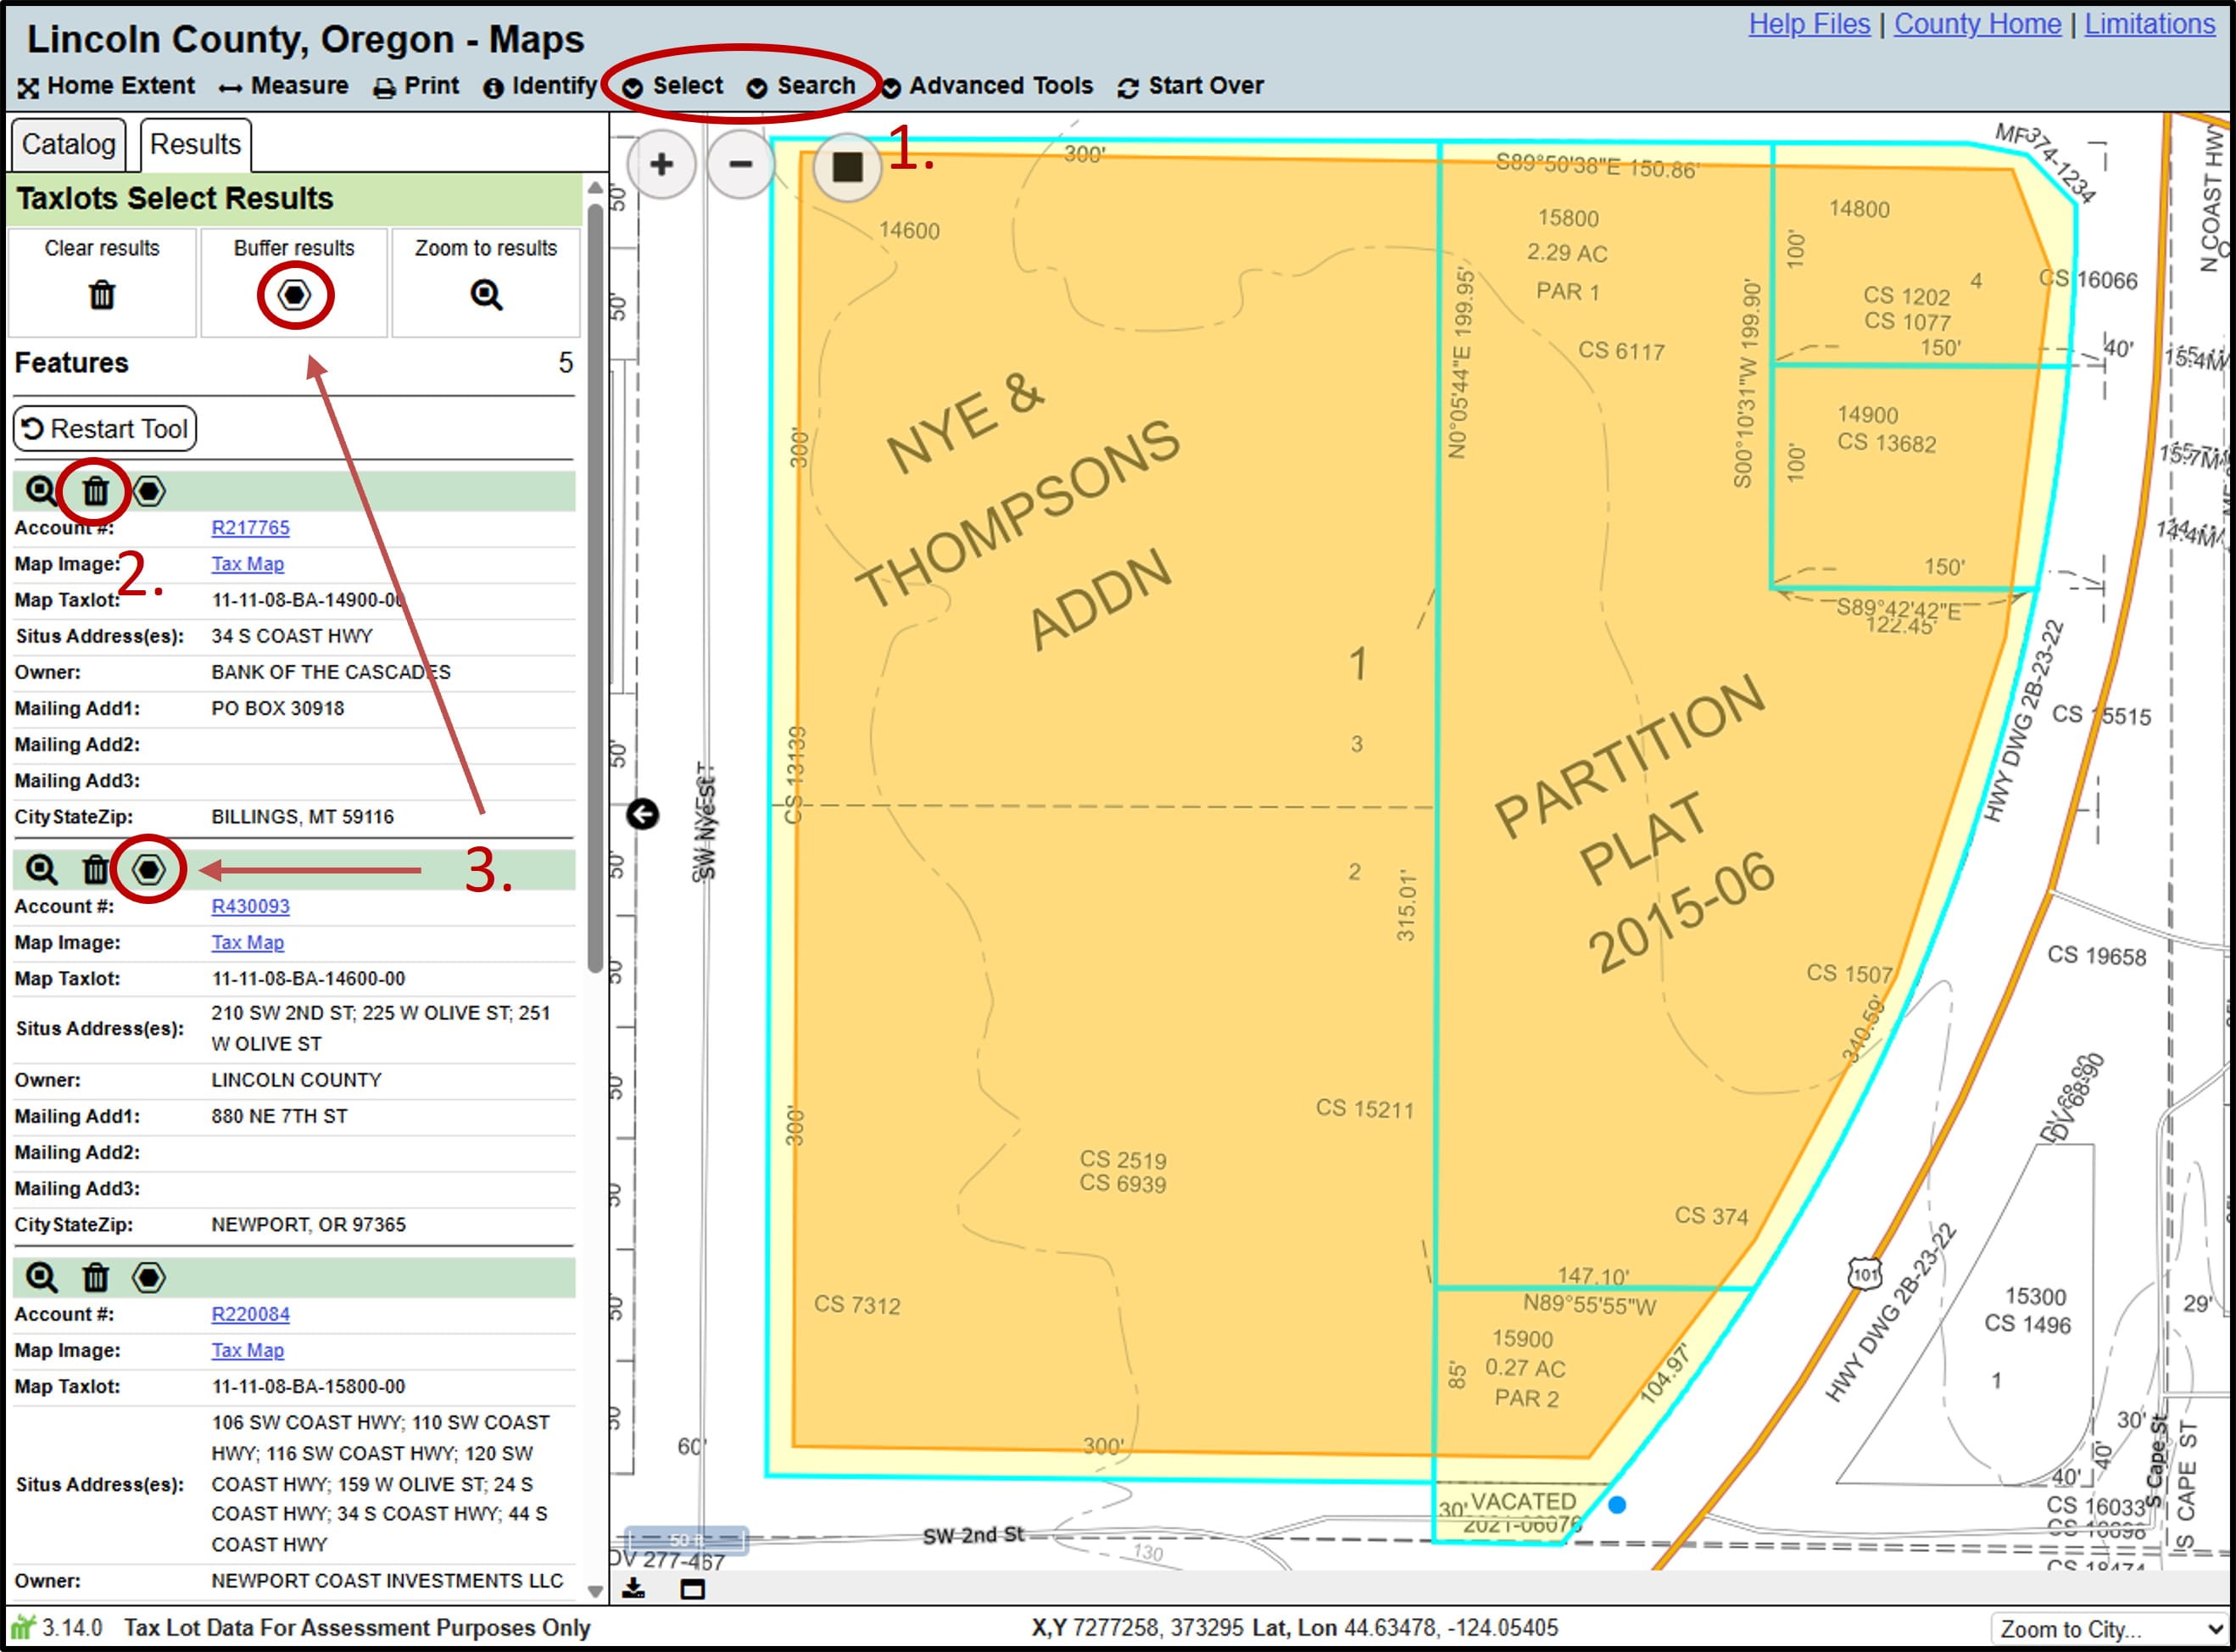
Taxlots Results
When using the Select or Search tools to find taxlots, your results will be appear in the results tab, and will also be highlighted on the map.
Additional tools are also available for selections and searches, which are described below.
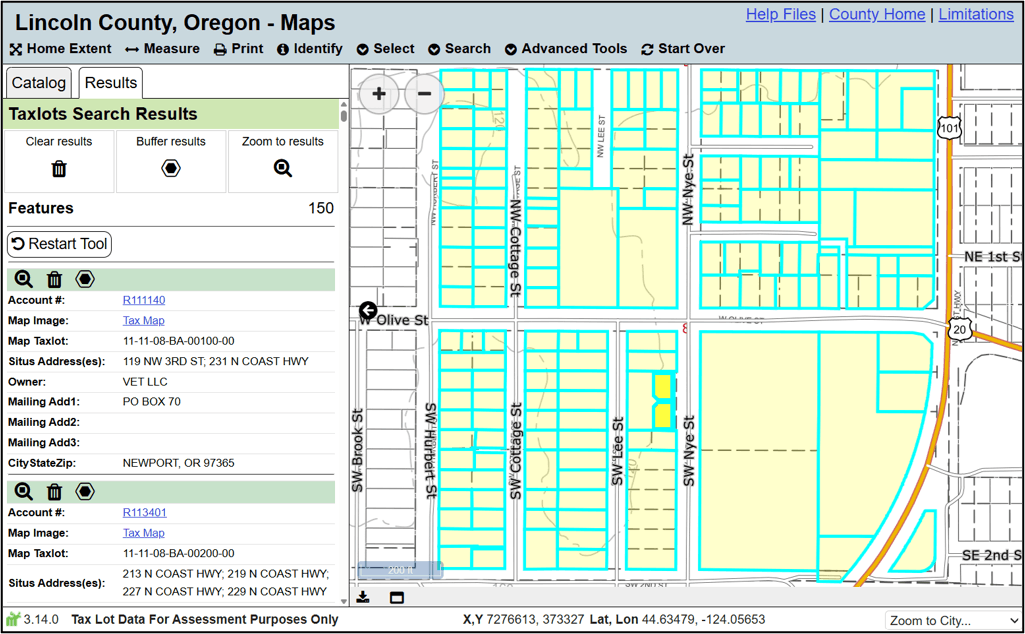
- Attributes
- For each taxlot, basic attribute information will be displayed, including owner information, parcel ID, situs address, and mailing address. Each taxlot also includes links to property web, where more information can be found for each tax account, as well as links to the tax map.
- Clear Results
- The trash can icon removes results. Activating the trash can icon at the top of the results tab clears all results, while activating the trash can icon in the header of an individual result will remove that particular taxlot from your results.
- The trash can icon
- Buffer Results
- The hexagonal icon
 allows you to buffer results, which allows you to find all features that are within a set distance of any result. For example, you could use the buffer tool to find all surveys that are within 50ft of a given taxlot. The buffer icon at the top of the results tab buffers the entire results, while the buffer icon in the header of an individual result buffers that specific feature. Buffering is described in more detail in the Buffer tool section of these help files.
- The hexagonal icon
- Zoom to Results
- The magnifying glass icon zooms your map to your results. Activating the icon at the top of your results will zoom to all results, while activating the icon in the header of an individual result will zoom to that particular taxlot. This is particularly useful for searches, as you may have results that span the entire county.
- The magnifying glass icon
- Download Results
- The download icon
 will download the results as a csv, which is a file format that can be opened in programs like Microsoft Excel. This icon is found at the left end of the footer that appears at the bottom of your map for any search or selection.
- The download icon
- Minimize/Maximize Grid
- The table icon
 , found in the left of the footer that appears at the bottom of your map for any search or selection, allows you to open your results in a table, giving you additional options for exploring the data.
- The table icon
- Zoom To, Clear Results, Buffer
- The table results also have the same tools as the tab results. These are found to the left of any individual result, allowing you to zoom to a result, remove a feature from your results, or buffer results.
- Sort
- The sort icon
 , found in the header of the results table, allows you to sort the data based on individual fields. It will alternate between ascending
  , descending
  , and returning to its original state .
- The sort icon
- Filter
- The filter icon
 , found in the header of the results table, allows you to filter out features from your results based on their attribute information. For example, if you click the filter button at the top of the situs addresses column, and scroll down to the bottom of the filter pop-up, you can uncheck 'Empty' to remove any results that don't have a situs address.
- The filter icon
Surveys Search Tool
One of the goals for Lincoln County's Online Maps is to provide you with searchable access to survey information in Lincoln County.
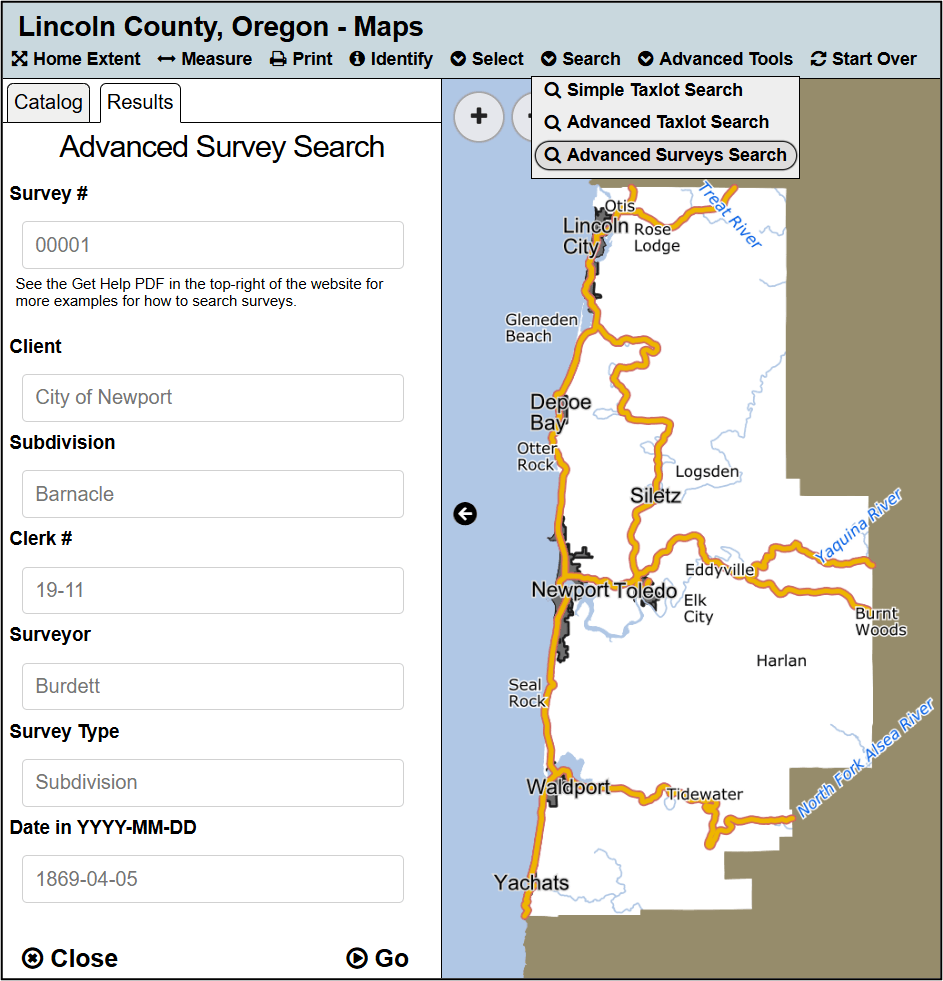
Advanced Surveys Search
The Advanced Surveys Search tool, found in the Search drop-down menu, allows you to search on multiple attributes when searching for surveys to more easily find specific results. The search options for the Advanced Surveys Search are Survey number, Client, Subdivision, Surveyor, Survey Type, and Date (in YYYY-MM-DD format).
Add information in the specific box to search for that attribute. Add information in multiple boxes to search for results that match both attributes. Placeholders are provided in light gray as examples for how to search the dataset. These placeholders are for reference only and don’t count as a search input.
Example 1
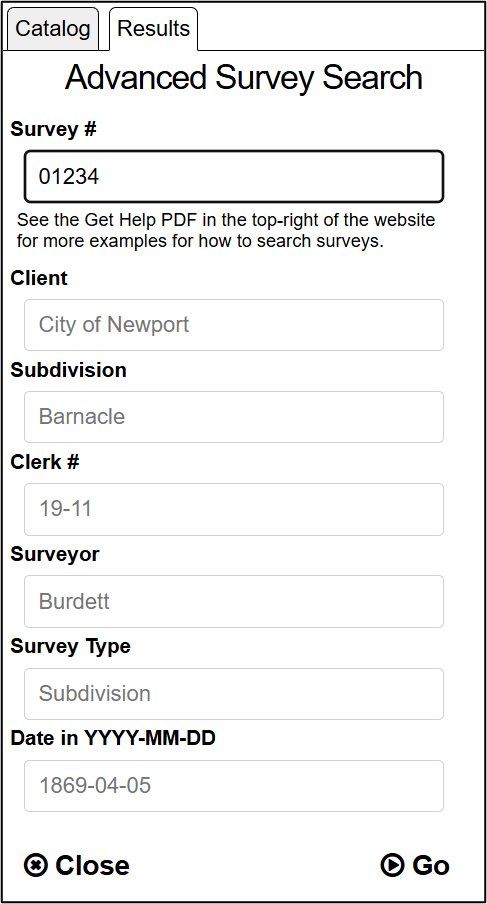
Find Survey Number "01234" by entering 01234 in the Survey Number box. Note that the survey number does not include CS (county survey) in front of it.
Example 2
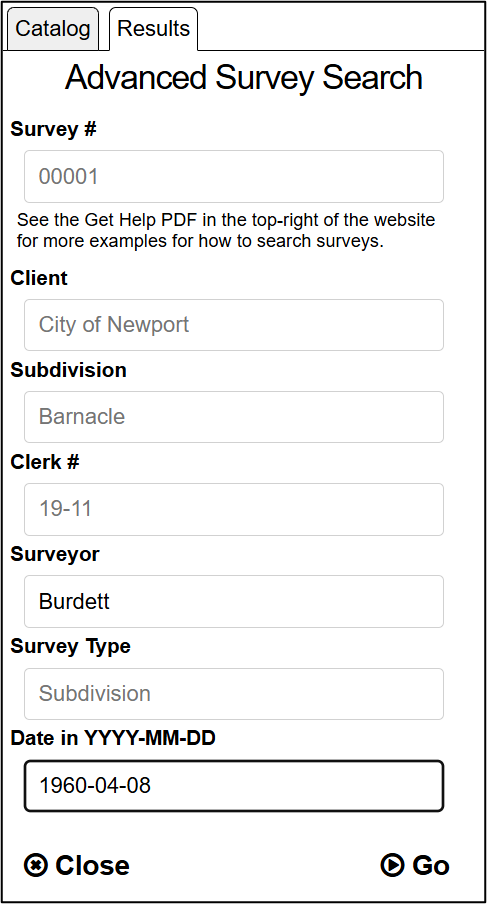
Find all surveys completed by "Burdett" on April 8th, 1960 by entering Burdett in the Surveyor box and 1960-04-08 in the Date box.
Example 3
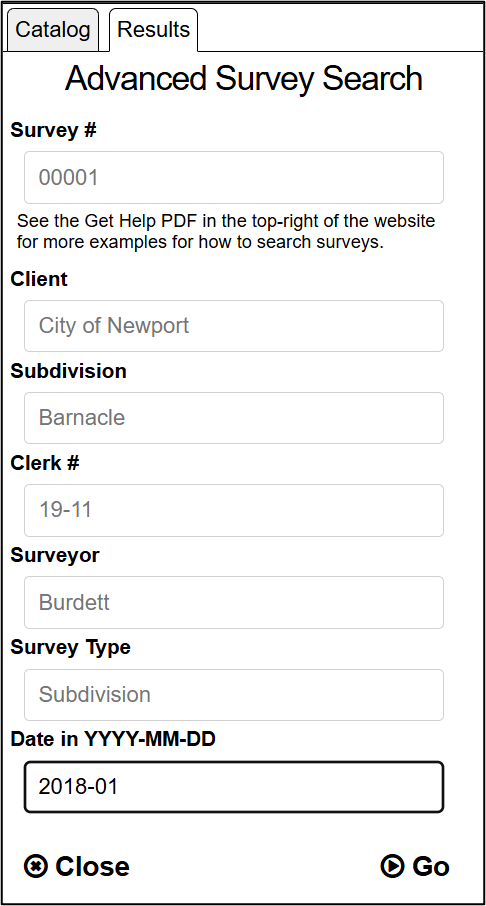
Find all surveys completed in January of 2018 by entering 2018-01 in the Date box.
Surveys Results
When using the Select or Search tools to find surveys, your results will be appear in the results tab, and will also be highlighted on the map.
Additional tools are available for selections and searches, which are described below.
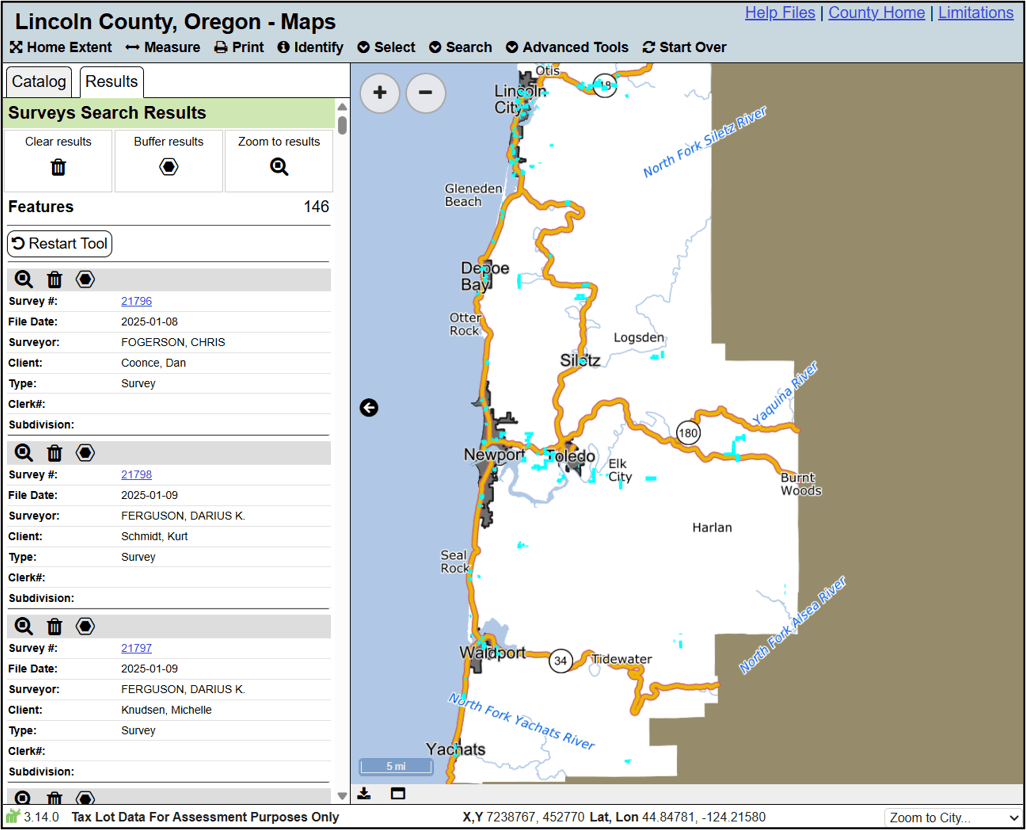
- Attributes
- For each survey, basic attribute information will be displayed, including the survey ID with a link to the survey, the file date (in YYYY-MM-DD), the Surveyor, Client, Survey Type, Clerk Number, and Subdivision (if applicable).
- Clear Results
- The trash can icon removes results. Activating the trash can icon at the top of the results tab clears all results, while activating the trash can icon in the header of an individual result will remove that particular survey from your results.
- The trash can icon
- Buffer Results
- The hexagonal icon allows you to buffer results, which allows you to find all features that are within a set distance of any result. For example, you could use the buffer tool to find all taxlots that are within 50ft of a given survey. The buffer icon at the top of the results tab buffers the entire results, while the buffer icon in the header of an individual result buffers a specific feature. Buffering is described in more detail in the Buffer tool section of these help files.
- The hexagonal icon
- Zoom to Results
- The magnifying glass icon zooms your map to your results. Activating the icon at the top of your results will zoom to all results, while activating the icon in the header of an individual result will zoom to that particular survey. This is particularly useful for searches, as you may have results that span the entire county.
- The magnifying glass icon
- Download Results
- The download icon will download the results as a csv, which is a file format that can be opened in programs like Microsoft Excel. This icon is found at the left end of the footer that appears at the bottom of your map for any search or selection.
- The download icon
- Minimize/Maximize Grid
- The table icon , found in the left of the footer that appears at the bottom of your map for any search or selection, allows you to open your results in a table, giving you additional options for exploring the data.
- The table icon
- Zoom To, Clear Results, Buffer
- The table results also have the same tools as the tab results. These are found to the left of any individual result, allowing you to zoom to a result, remove a feature from your results, or buffer results.
- Sort
- The sort icon , found in the header of the results table, allows you to sort the data based on individual fields. It will alternate between ascending , descending , and returning to its original state .
- The sort icon
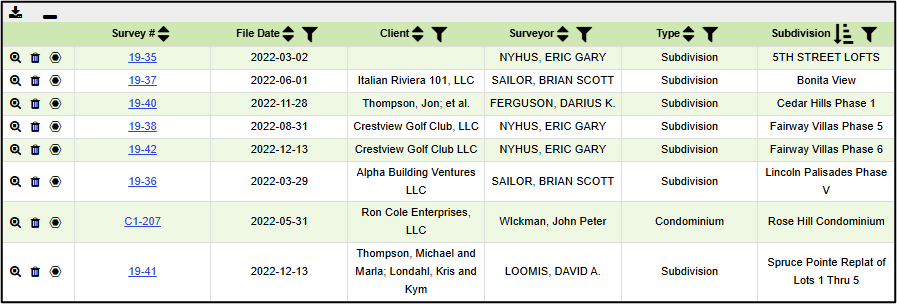
- Filter
- The filter icon , found in the header of the results table, allows you to filter out features from your results based on their attribute information. For example, if you wanted to find all subdivisions in 2022, you could search for all surveys with a File Date of 2022, click the filter icon at the top of the Survey Type column, uncheck Select All at the type of the filter pop-up, recheck Subdivision in the filer results, and click Set in the bottom-right of the filter pop-up.
- The filter icon
Results
Once you have results on your map, you have additional ways of interacting with your data (as mentioned in previous sections of these help files).
For identify results, you are limited to the results that you can see in the results tab to the left of the map. This tab includes basic attribute information for each dataset, the ability to remove or zoom to results, as well as details for the total number of identifiable layers in the map and the total number of results found. See the Identify Results section of these help files for more details.
For selections and searches, you have additional options. At the top of your results, there are icons for clearing results , zooming to results , and buffering results (which will be discussed Buffer tool section of these help files). The same tools are found in the header for each individual result, allowing you to zoom to, remove, or buffer individual results. Your results are are also highlighted on your map.
- Attributes
- The attribute information for your results will be found in the results tab to the left of the map. Some datasets include links to additional information, like the tax map or property report for taxlots, and the scanned survey for surveys.
- Clear Results
- The trash can icon removes results. Activating the trash can icon at the top of the results tab clears all results, while activating the trash can icon in the header of an individual result will remove that feature from your results.
- The trash can icon
- Buffer Results
- The hexagonal icon allows you to buffer results, which allows you to find all features that are within a set distance of any result. For example, you could use the buffer tool to find all surveys that are within 50ft of a given taxlot. The buffer icon at the top of the results tab buffers the entire results, while the buffer icon in the header of an individual result buffers a specific feature. Buffering is described in more detail in the Buffer tool section of these help files.
- The hexagonal icon
- Zoom to Results
- The magnifying glass icon zooms your map to your results. Activating the icon at the top of your results will zoom to all results, while activating the icon in the header of an individual result will zoom to that result. This is particularly useful for searches, as you may have results that span the entire county.
- The magnifying glass icon
- Download Results
- The download icon will download the results as a csv, which is a file format that can be opened in programs like Microsoft Excel. This icon is found at the left end of the footer that appears at the bottom of your map for any search or selection.
- The download icon
- Minimize/Maximize Grid
- The table icon , found in the left of the footer that appears at the bottom of your map for any search or selection, allows you to open your results in a table, giving you additional options for exploring the data.
- The table icon
- Zoom To, Clear Results, Buffer
- The table results also have the same tools as the tab results. These are found to the left of any individual result, allowing you to zoom to a result, remove a feature from your results, or buffer results.
- Sort
- The sort icon , found in the header of the results table, allows you to sort the data based on individual fields. It will alternate between ascending , descending , and returning to its original state .
- The sort icon
- Filter
- The filter icon , found in the header of the results table, allows you to filter out features from your results based on their attribute information. For example, if you click the filter button at the top of the situs addresses column, and scroll down to the bottom of the filter pop-up, you can uncheck 'Empty' to remove any results that don't have a situs address.
- The filter icon
Buffer Tool
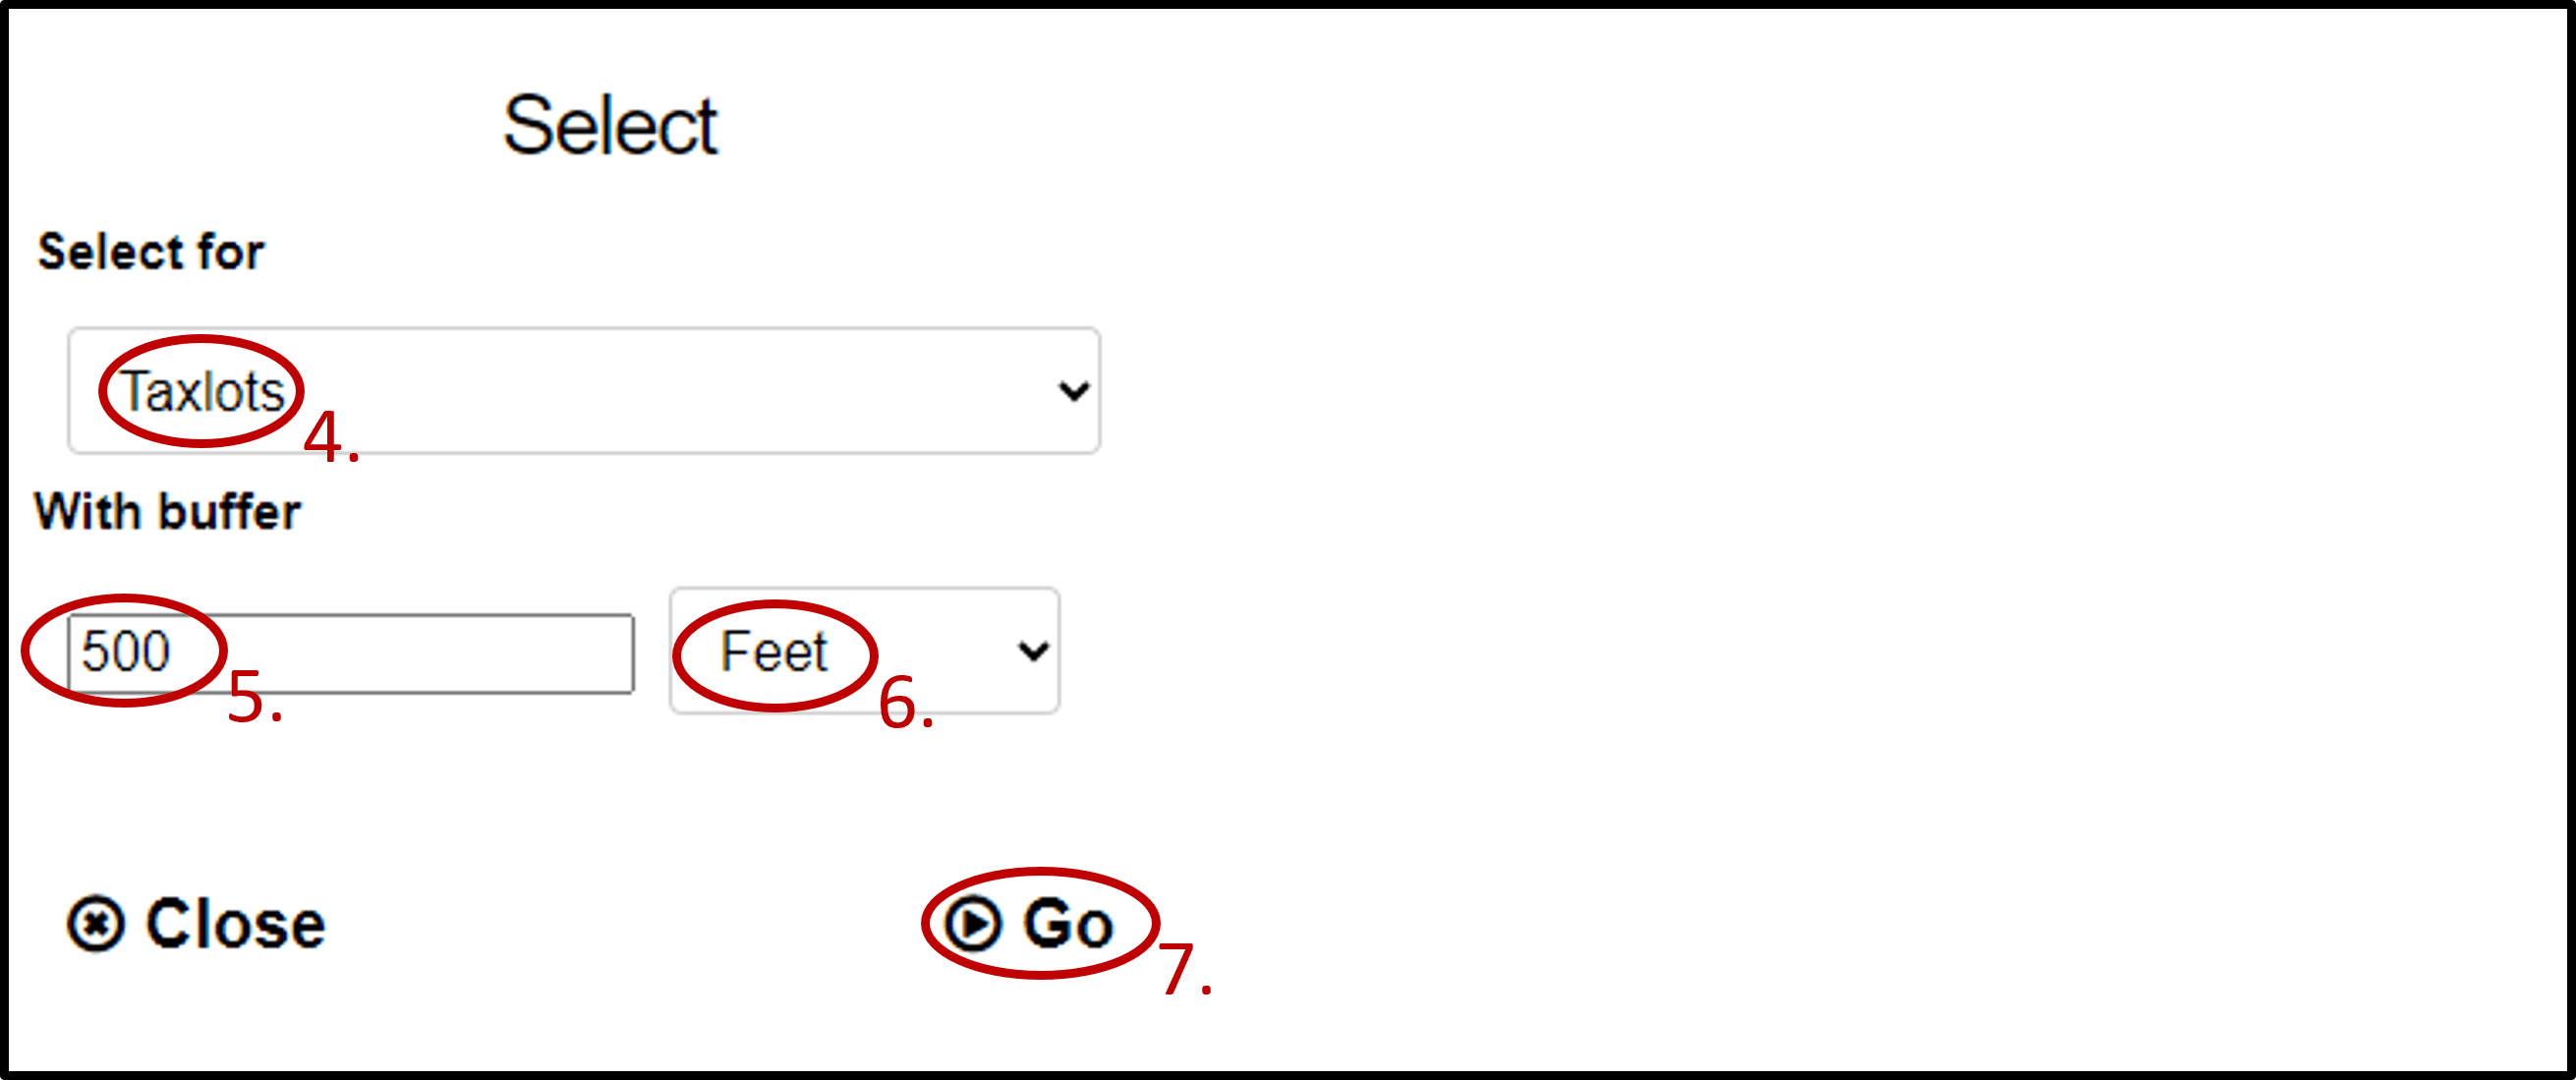
In order to use the Buffer tool, you first need to use either the select or search tools to find results. Once you have results on your map, you can use the Buffer tool to select data that aligns with results on your map. You can either can either buffer individual results, or all results.
For example, by selecting a taxlot and running the Buffer tool, you can then enter 500 feet in the text box to find all taxlots that are within 500 feet of the selected taxlot.
- Use the select or search tools to find results.
- Refine your results by deleting individual results if needed using the trash can icon in the header of the result.
- Click the "Buffer feature" icon (from the header of an individual result, or the header from all results).
- Choose the dataset you wish to buffer for (the results you wish to find on the map).
- Specify the distance around the feature(s) you wish to use for the buffer using the With Buffer box. Notice how as you increase this distance, the buffer geometry on your map updates.
- Specify the unit of measurement.
- Click "Go" in the bottom-right of the Buffer tool
Measure Tool
Use the Measure tool to find coordinates, determine the length of lines, or measure the area of results or sketches.
First choose the measurement type, and adjust the measurement unit if needed. Any measurements you make will show in the results tab below the measure tool.
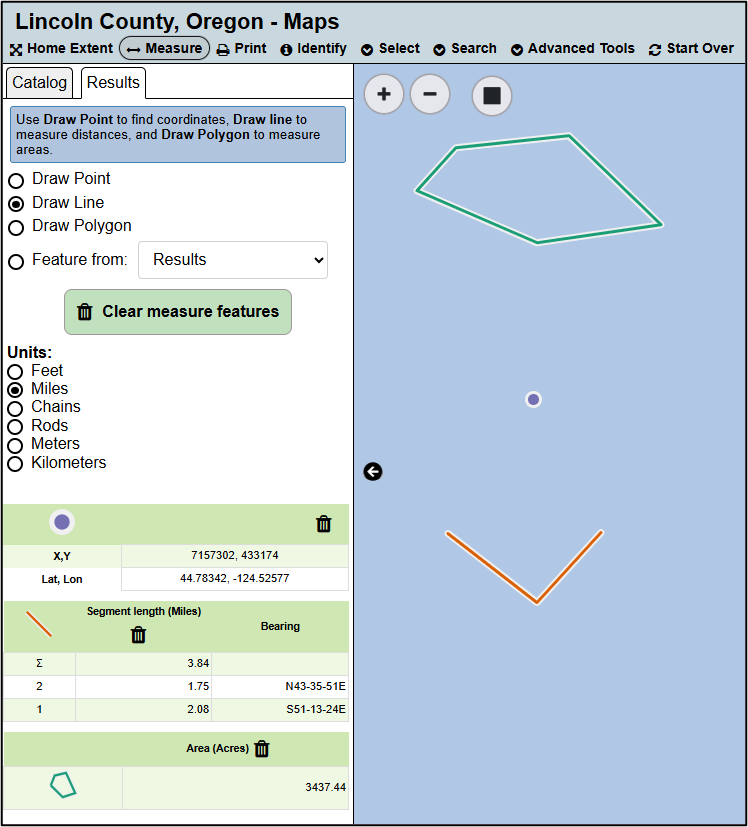
- Draw Point
- Click on the map to find coordinates at a given location.
- Draw Line
- Click on the map to measure distances and bearings on lines. Click to add vertices. Double click to finish your measurement.
- Draw Polygon
- Measure the area of polygons by clicking on the map to add vertices, and double clicking to finish your measurement.
- Feature from Results or Drawing and Markup
- If you have results or sketches on your map, you can click on a feature to measure it. After measuring a feature from result, click anywhere else in your map to remove the measurement.
- Measurement Units
- Changing the measurement units will change the units for any current or future measurements. To change the units for lines, make sure draw line is selected. To change the units of polygons, make sure draw polygon is selected. For lines, your options are feet, miles, chains, rods, meters, or kilometers. For polygons, your options are square feet, square miles, acres, hectares, square meters, or square kilometers.
- Removing Measurements
- To remove measurements, click the trash can icon next to a measurement, or click the clear measure feature button to remove all measurements. If you have measured any features from results or sketches, you need to unselect the feature by clicking anywhere else in your map.
- To remove measurements, click the trash can icon
Sketch Tools
The Drawing and Markup tools in the catalog tab allow you to add sketches to your map. These features will exist as long as your map is open, are included in any map you print, and can be exported
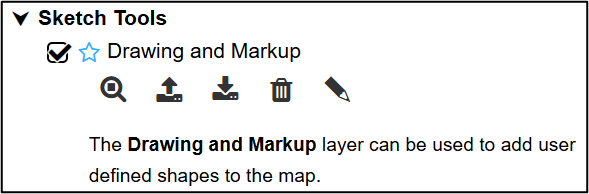
Below is a list of the available sketch tools in the catalog.
- Zoom to Sketch
- The magnifying glass icon will zoom to the extent of any sketches in your map.
- The magnifying glass icon
- Upload Features
- The upload features icon
 allows users to import sketches from other programs (such as QGIS, Google Earth, or Google Maps). Uploaded files must be KMLs or GeoJSONs and be in WGS 84 (EPSG:4326).
- The upload features icon
- Download Features
- The download features icon allows users to download custom sketches to either a KML or GeoJSON, which can be imported into other programs.
- The download features icon
- Remove Sketches
- The trash can icon will remove any sketches from your map.
- The trash can icon
- Open Drawing Tools
- The pencil icon
 allows you to open the drawing tools, which allow you to add sketches to your map.
- The pencil icon
Once you open the drawing tools, additional tools will appear in the top-left corner of your map, allowing you to draw points, lines, or polygons, modify your drawings, or change the attributes of your drawings. Hovering over an icon will display a tooltip that tells you the function of that tool.

- Add a Point
- The add point icon
 allows you to add a point to the map.
- The add point icon
- Add a Polygon
- The add polygon icon
 allows you to add a polygon to your map.
- The add polygon icon
- Add a Line
- The add line icon
 allows you to add a line to your map.
- The add line icon
- Modify a Drawn Feature
- The pencil icon allows you to edit the geometries of any sketches that you've already added to your map. To use this tool, simply click the modify icon, and then click on any sketch in your map.
- The pencil icon
- Remove a Feature
- The remove icon
 allows you to remove a sketch from your map. In order to use it, click on the remove icon, and then click on any sketch in your map.
- The remove icon
- Edit Feature Properties
- The edit icon
 allows you to open the attributes of any sketch, controlling its appearance, including color, size, transparency, and labels.
- The edit icon
- Close Sketch Tools
- The close
 icon closes the sketch tools.
- The close
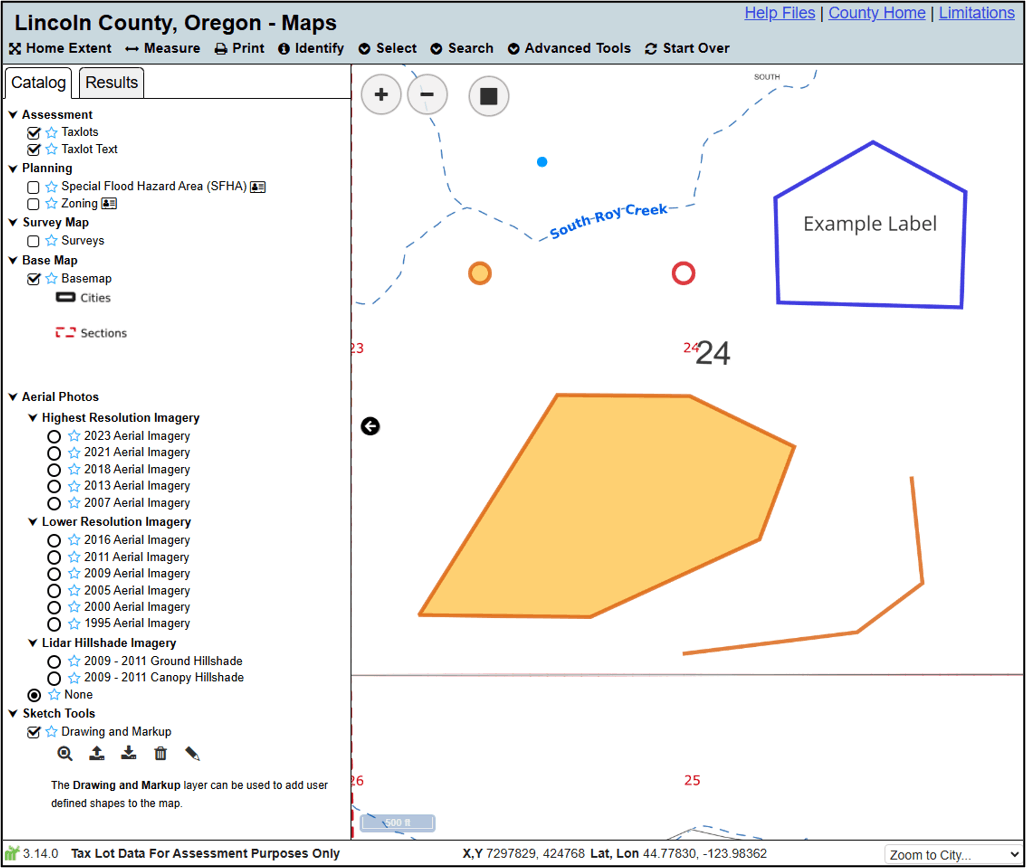
Adding Points, Lines, or Polygons
When you activate the tools that add a point, line, or polygon to your map, your cursor will change to include a blue dot, indicating that a tool is active. For points, click on the map to add a point. For lines and polygons, click to add vertices and double-click to finish your line or polygon. When you add a sketch to your map, a pop-up will appear that allows you to control how the sketch looks. You can choose to either adjust colors, transparency, size, or labels, or accept the default options.
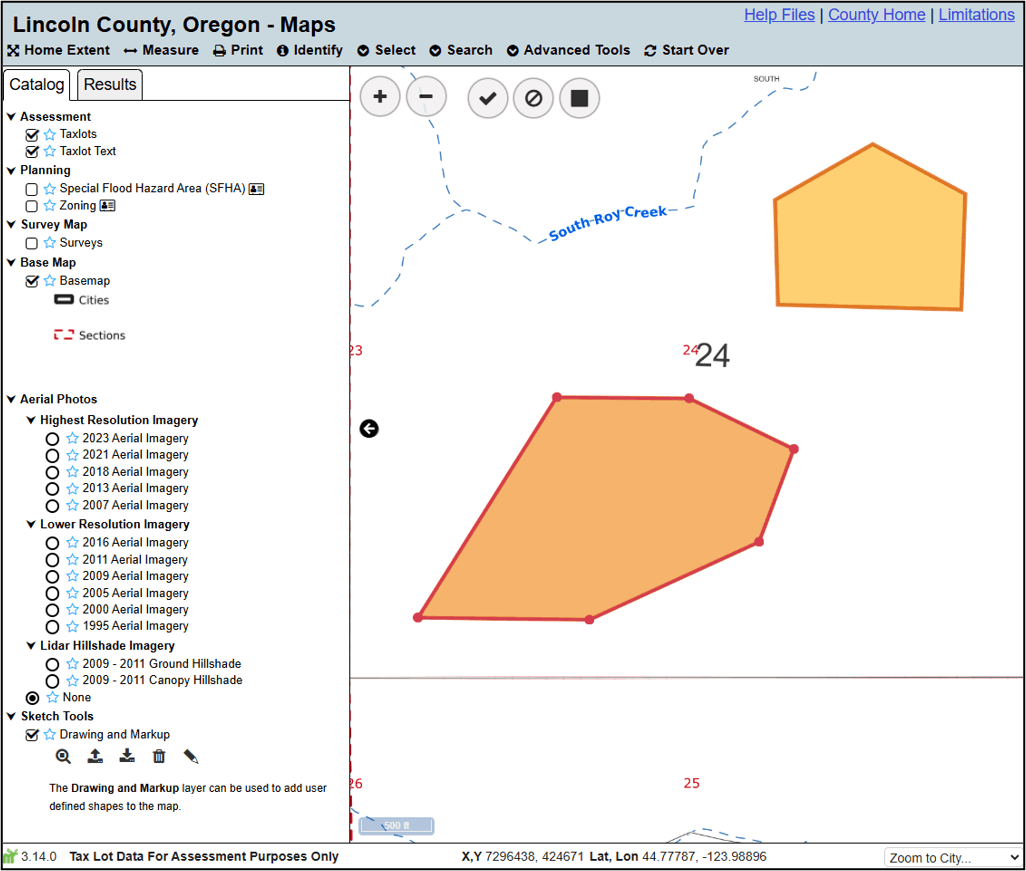
Editing Sketches
Click the ‘Modify a drawn feature’ button to edit the geometries of sketches you’ve created, and then click on the drawing you would like to edit. The sketch will be highlighted. You can then click and drag points to move vertices, and click and drag line segments to add new vertices. Click the checkmark to accept changes and the cancel changes button to discard changes.
Editing Feature Attributes
To change how features appear on your map, click the 'Edit feature properties' button , and then click on a sketch. A pop-up will appear allowing you to edit the appearance of the sketch. These are the same options that appear when you initially create a drawing.
Edit Labels
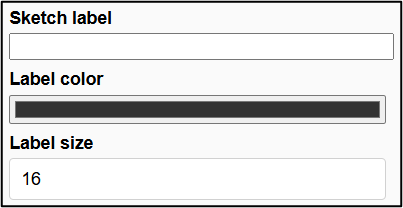
Add labels, change label color, and change label size.
Edit Stroke
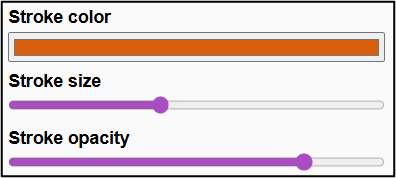
Change the color, size, and opacity of the outline (the stroke) of sketches.
Edit Points
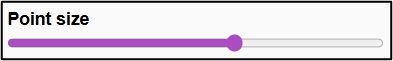
Change the size of points. This option is only relevant when editing points.
Edit Fill
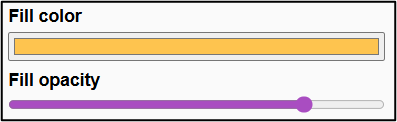
Change the color and opacity of the interior (the fill) of sketches. These options are not relevant for lines as they don't have a fill.
Frequently Asked Questions (FAQ's)/Common Issues
The Site and/or the data in the map aren't loading properly
If the issue is the site itself, refreshing your browser and/or clearing your cache may solve the problem. Sometimes new features are implemented, which can cause issues if your browser is caching old files. If new features have been implemented since you last refreshed your browser, you’ll need to refresh your browser to see any changes.
If the issue is the data in your map, check to make sure you’re accessing the site at https://maps.co.lincoln.or.us (without any additional parameters after the base URL). Your location in the map, as well as any datasets that are on in the catalog, are both tracked in the URL. This allows you to create bookmarks and share your map with others, which overwrites the default datasets and map extent. If you access your map via a bookmark, rather than the base URL, you may have issues if the default datasets change (i.e. new datasets are added, or the names of existing datasets change). Using the Start Over tool on the toolbar, or manually navigating to https://maps.co.lincoln.or.us are both valid ways of correcting this.
I searched for an address and got zero results
The search tools don’t use a complex algorithm to return results like Google does. They simply look for features within the data that contain your search. If there are zero matches you will get zero results. Due to how the taxlot data is formatted, there are various things that can cause you to get zero results. For example, one property owned by the City of Siletz has the address of '149 W Buford Ave'. If you omit the direction in the address or type Avenue instead of the abbreviation, you may get zero results.
In general, providing less specific information will return more results. For example, if you’re attempting to include the full address in the search and aren’t getting the results you want, you can just search by the street name. If you open the Advanced Taxlot Search Tool and search for Buford in the Situs Address box, you will get all the taxlots that have an address on any road named Buford. From there you can fine-tune your results by opening the table at the bottom of the map and exploring the results by sorting the data (to look for a particular address, Parcel ID, or Owner Name) or by filtering by Owner information.
I'm trying to use a tool (measure, identify, select, sketch) and anytime I click on the map to use the tool the map moves rather than running the tool
You pan around the map by clicking on the map, holding the mouse button down, and moving the mouse. This allows you to drag the map around and look at different areas. This is active even when other tools are active. This is helpful because it allows you to navigate the map while a tool is active (i.e. you can start a selection, realize you’re in the wrong location, and still zoom out and pan to the correct location without having to close the tool). To use the tools instead of panning around the map, you need to make sure your mouse isn’t moving when you click on the map. If your mouse is moving at all when you click on the map, you will pan around the map instead of running the tool.
I’m trying to search for a taxlot by Parcel ID (Map Taxlot Number) and am getting no results
Make sure you’re using the full map and taxlot number, including any leading and trailing zeros for the township, range, section, and taxlot number. For example, a valid map and taxlot number in northeast Lincoln County is 07-09-06-00-00400-00. Notice how the township range and section are both single digits but have a leading zero to force them to be two digits. Similarly, the taxlot number is three digits, but has two leading zeros to force it to be 5 digits.